So today I release the v4.0.0 version of sloc cloc and code AKA scc. While I was considering going from 3.7.0 to 3.8.0 enough new functionality landed in it that I figured a move to a new major version was worthwhile. It also was large enough to warrant another blog post going into some details, because I am genuinely excited about some of the new features in it.
I am going to go through a few of them in this post and hopefully encourage you dear reader to get the latest version and try it out.
Hotspots
I had written over 10 years ago about Google’s bug prediction which ranked files using commit history against bug fixes to determine where problematic files existed. It was interesting but discontinued because, quote:
TL;DR is that developers just didn’t find it useful. Sometimes they knew the code was a hot spot, sometimes they didn’t. But knowing that the code was a hot spot didn’t provide them with any means of effecting change for the better.
Hilariously, I forgot I wrote about this, and got multiple LLMs to find it for me, and they all linked back to that post on my blog when I asked them to find it. Apparently I am the “authoritative source” on it now.
I had always kept this in the back of my mind as something I’d like to explore more (hence trying to find it again). Recently I had a thought, since scc has a complexity estimate, can we use that to dampen out the noise? After all knowing a lot of fixes applied to a config file is not very useful, however knowing that lots of changes applied to a file with a lot of logic is. This is the same approach I took to ranking in codespelunker.

Complex files need the most attention!
As far as I can tell this is a reinvented idea from Adam Tornhill in “Your Code as a Crime Scene” (I am still reading the book after discovering this) and he even went off to create the company CodeScene as a result. Clearly there is some value in this metric.
So much for me having an original idea.
Anyway, let’s have a look at what you get, with scc running against its own codebase,
$ scc --hotspots
───────────────────────────────────────────────────────────────────────────────
Hotspots · last 1000 commits · 2019-07-21 → 2026-06-26
───────────────────────────────────────────────────────────────────────────────
File                            Lang   Cmplx  Commits   Lines±  Authrs  Hotspot
───────────────────────────────────────────────────────────────────────────────
processor/processor.go            Go     156      156    1,651      13    100.0
processor/workers.go              Go     244       92    3,617      15     92.2
test-all.sh                    Shell      56      181    3,287      15     41.7
~ocessor/formatters_test.go       Go     183       51    2,459       9     38.4
processor/workers_test.go         Go     408       21    1,189       8     35.2
processor/formatters.go           Go      44      135    5,848      17     24.4
main_test.go                      Go     261       18      995       6     19.3
processor/detector_test.go        Go     133       32    1,175       6     17.5
main.go                           Go      40      101    1,545      17     16.6
processor/file.go                 Go      50       73    2,074      12     15.0
processor/detector.go             Go      70       45      948       5     12.9
processor/file_test.go            Go      75       33      826       5     10.2
cmd/badges/main.go                Go      73       31    1,111       5      9.3
processor/history.go              Go     173        9      941       4      6.4
processor/structs.go              Go      25       42      247      10      4.3
config_test.go                    Go     199        4      850       3      3.3
~workers_regression_test.go       Go      50       13      276       6      2.7
~rocessor/processor_test.go       Go      51       12      289       4      2.5
~ocessor/history_authors.go       Go     111        5      666       3      2.3
mcp.go                            Go      71        7      527       4      2.0
───────────────────────────────────────────────────────────────────────────────
   complexity × change-frequency, normalised · 20 of 90 files shown
───────────────────────────────────────────────────────────────────────────────
As you can see the output has correctly identified that processor/processor.go and processor/workers.go are the hotspots in the codebase. I can confirm this is correct based on my own personal experience.
Why should you care? Because that summary is doing something neither complexity nor churn can do by itself.

Explain how!
In short hotspot = complexity × commit_count normalised on a scale of 0-100. We calculate the complexity for the current HEAD file, then walk backwards seeing how many times each file was changed. Note that this only counts files in HEAD. High churn files that were removed are not counted.
Lets compare it to a plain count,
$ scc --by-file -i go -s complexity
───────────────────────────────────────────────────────────────────────────────
Language            Files       Lines    Blanks  Comments       Code Complexity
───────────────────────────────────────────────────────────────────────────────
Go                     69      40,137     3,049     2,131     34,957      4,478
───────────────────────────────────────────────────────────────────────────────
processor/workers_test.go       2,156       374        69      1,713        408
main_test.go                      992        80        26        886        261
processor/workers.go              966       146       102        718        244
processor/report_test.go          971        98       109        764        237
config_test.go                    786        50        85        651        199
By running a simple plain count, limited to Go files and sorted by complexity we see that workers_test.go, main_test.go and config_test.go are all ranked highly. All of these files are technically complex, but none of them are where the hard development work actually exists. Complexity on its own tells you where large files with if conditions exist. Turns out that is often test files. They are still in the list, just demoted. Of course high churn test files will still rise to the top with this as you would expect.
Flip it and rank by churn, that is, the number of commits. Now test-all.sh is your number one with 181 commits, and structs.go floats up with 42. Both change constantly, but neither is where the bugs or logic are. Churn on its own tells you what changes a lot, which is often config, scripts, and boilerplate, but not quite a proxy for bugs or logic.
What is a reasonable proxy however is the overlap of both churn and complexity. What files are complicated and have a lot of change! Note that this is not quite what Google had tried and failed with. This metric is not a “historically buggy” pointer, but a “hard to work with” indicator, possibly suggesting that code needs to be broken apart.
So why is that useful? Well complex code that nobody edits probably isn’t an issue. It works and you move on. Simple files you change all the time probably aren’t an issue either. You add a line of config, the compiler checks it and you move on. However a file that is complex and changes a lot is where problems usually lie. It’s where you get the most merge conflicts, most breaking tests, and pain when it comes to making changes.
Now I already knew this for the scc codebase, but imagine I am not familiar with it. I just identified where the beating engine of the application lies.
Bringing it back to Google, they flagged risky files and developers didn’t care because knowing where a hotspot is does not help you do anything about it. Knowing “this is buggy” is just another flag in your CI/CD giving you more work (throw it on my technical debt credit card). Knowing the hotspots in a codebase you know about isn’t that useful. However it is extremely helpful to know hotspots when onboarding and learning a codebase, and this is telling you the answer to that exact question.
Google failed because a hotspot flag gives you no action, but a similar idea pointed at an unfamiliar codebase becomes an onboarding map. - Me
One other thing you can do is specify the depth in git commits that this is calculated for. We can find out where hotspots have shifted by looking backwards over less or more commits (time).
Looking back 50 commits vs 10,
$ scc --hotspots --depth 50
───────────────────────────────────────────────────────────────────────────────
Hotspots · last 50 commits · 2026-04-13 → 2026-06-26
───────────────────────────────────────────────────────────────────────────────
File                            Lang   Cmplx  Commits   Lines±  Authrs  Hotspot
───────────────────────────────────────────────────────────────────────────────
processor/processor.go            Go     156       14      415       4    100.0
main_test.go                      Go     261        8      295       4     95.6
processor/history.go              Go     173        9      941       4     71.3
processor/workers.go              Go     244        6      130       5     67.0
processor/workers_test.go         Go     408        3      157       3     56.0

...

$ scc --hotspots --depth 10
───────────────────────────────────────────────────────────────────────────────
Hotspots · last 10 commits · 2026-06-25 → 2026-06-26
───────────────────────────────────────────────────────────────────────────────
File                            Lang   Cmplx  Commits   Lines±  Authrs  Hotspot
───────────────────────────────────────────────────────────────────────────────
processor/workers.go              Go     244        2       15       1    100.0
processor/processor.go            Go     156        3       20       1     95.9
config_test.go                    Go     199        2        5       2     81.6
processor/history.go              Go     173        1       19       1     35.5
regression_test.go                Go     152        1        6       1     31.1
Now one thing to keep in mind, this does not tell you anything is wrong with the codebase. Only where to consider looking. You could have an especially nasty bug sitting in that config file. It is only an indicator!
Still as the saying goes, all models are wrong, some are useful.
Note that none of the above requires git to be installed. While it does need the repository to have a .git folder and the files it needs, scc ships with github.com/go-git/go-git in it and remains a single binary install with all the functionality you need.
Of course, none of this is calculated for free… So what is the cost for this power?

It takes time to do things now! - Sir Humphrey Appleby
This had never been the case for scc. It has always been fairly quick (I refuse to say blazing fast) to run and produce results. However it was only ever dealing with the now, IE the current state of the codebase.
Dealing with things over time means walking backwards over the git history, for 1000 commits by default (you can of course override this). The result is that it’s slower than a standard scc process.
$ hyperfine 'scc' 'scc --hotspots'
Benchmark 1: scc
  Time (mean ± σ):      11.2 ms ±   0.4 ms    [User: 15.2 ms, System: 7.6 ms]
  Range (min … max):    10.6 ms …  13.5 ms    194 runs

Benchmark 2: scc --hotspots
  Time (mean ± σ):      4.739 s ±  0.068 s    [User: 3.341 s, System: 1.611 s]
  Range (min … max):    4.707 s …  4.930 s    10 runs

Summary
  scc ran
  421.57 ± 14.52 times faster than scc --hotspots
The above was calculated on my Macbook Air 2020 M1 against the scc codebase itself. It’s not slow per se, but certainly not as fast as the ~12ms it takes scc to run normally over that codebase on the same machine. Is this fast? I have no idea. I have not used codescene myself. Perhaps someone can let me know. I did try running bugspots for comparison, but perhaps due to the age of the codebase could not get it working.
Change Coupling
Since I was already lifting the hotspot idea from CodeScene I thought I would also take change coupling feature. The general idea is that files are dependent on each other if they appear in the same commit constantly regardless of whether a compiler enforced dependency exists.
Running it against scc itself produces the following trimmed output,
$ scc --coupling
───────────────────────────────────────────────────────────────────────────────
Change Coupling · last 1000 commits · 2019-07-25 → 2026-07-20
───────────────────────────────────────────────────────────────────────────────
File A                      File B                      Shared Commits Coupling
───────────────────────────────────────────────────────────────────────────────
languages.json              processor/constants.go                 198    67.8%
LANGUAGES.md                languages.json                         167    61.2%
LANGUAGES.md                processor/constants.go                 153    58.2%
SCC-OUTPUT-REPORT.html      processor/constants.go                 149    37.7%
Where the output shows that a change in languages.json modifies processor/constants.go most of the time. This is true, as are the other outputs in the above, as every time a new language is added or modified each of the files above change as well.
While interesting, its far more useful when applied per file,
$ scc --coupling-for ./processor/detector.go
───────────────────────────────────────────────────────────────────────────────
Change Coupling · last 1000 commits · 2019-07-25 → 2026-07-20
───────────────────────────────────────────────────────────────────────────────
Related File                                          Shared Commits   Coupling
───────────────────────────────────────────────────────────────────────────────
processor/detector_test.go                                        26      49.1%
processor/workers.go                                              15      12.1%
processor/structs.go                                               9      11.1%
processor/file_test.go                                             7       9.7%
processor/workers_test.go                                          6       9.7%
processor/processor_test.go                                        5       9.4%
Now this is far more interesting, although in this case showing the obvious. If you change the detector you probably need to change the tests for it. Where this really helps is when you are working on random files and want to know the potential blast radius that isn’t covered by your compiler checks.
However coupling like this potentially has the same issue that files that aren’t code may get picked up. As such we can apply our hotspots trick of weighting by complexity to get the below,
$ scc --coupling-weighted --coupling-for ./processor/detector.go
───────────────────────────────────────────────────────────────────────────────
Change Coupling · last 1000 commits · 2019-07-25 → 2026-07-20
───────────────────────────────────────────────────────────────────────────────
Related File                                          Shared Commits      Score
───────────────────────────────────────────────────────────────────────────────
processor/detector_test.go                                        26      100.0
processor/workers.go                                              15       57.7
processor/processor.go                                            13       50.0
processor/workers_test.go                                          6       23.1
processor/file_test.go                                             7       22.7
processor/file.go                                                 10       21.6
processor/formatters.go                                            8       16.9
The file structs.go has fallen out of the top results due to this, which is probably correct considering it just contains struct definitions. So in effect low logic files are demoted. Is this tweak useful? I don’t know, hence it being gated behind another CLI flag.
Regardless, the coupling options themselves are there for use, and possibly most useful exposed over MCP for LLMs to consume.
Git Metrics
In addition to the hotspot and coupling calculation you get other git outputs, such as working out what is the trend of code over time? Useful for watching that JS to TS rewrite in real time.
$ scc --timeline
───────────────────────────────────────────────────────────────────────────────
Languages · last 1000 commits · 2019-07-21 → 2026-06-26
───────────────────────────────────────────────────────────────────────────────
Language             Trend                             Code    Share     Change
───────────────────────────────────────────────────────────────────────────────
Go                   ▂▂▂▂▂▂▂▂▂▃▃▃▃▃▃▃▃▃▃▃▃▄▆▆▆▇      37,868    65.2%    +33,595
JSON                 ▄▄▄▄▄▄▄▄▄▄▅▅▅▅▅▅▅▅▆▆▆▆▆▆▆▇      12,944    22.3%     +6,236
HTML                 ▁▁▂▂▆▆▆▆▆▆▆▆▆▆▆▆▆▇▅▅▅▅▅▅▅▆       3,160     5.4%     +3,160
Markdown             ▃▃▃▃▄▄▄▄▄▅▅▅▅▅▅▅▅▅▅▅▆▆▆▆▆▇       1,884     3.2%     +1,386
Shell                ▂▄▄▄▅▅▅▅▅▅▅▅▅▅▆▆▆▆▆▆▆▆▇▆▅▄       1,200     2.1%       +993
Go Template          ▁▁▁▁▁▁▁▁▁▁▁▁▁▁▁▁▁▁▁▁▁▃▆▆▆▇         598     1.0%       +598
Python               ▁▁▁▁▁▁▁▁▁▁▁▁▁▁▁▅▅▅▅▅▅▅▅▅▅▇         225     0.4%       +225
YAML                 ▃▃▃▃▃▃▃▃▃▃▃▃▆▆▆▆▆▇▇▇▇▇▇▇▇▇          52     0.1%        +33
Powershell           ▇▇▇▇▇▇▇▇▇▇▇▇▇▇▇▇▇▇▇▇▇▇▇▇▇▇          46     0.1%         +0
gitignore            ▅▅▅▅▆▆▆▆▆▆▆▆▆▆▆▆▆▆▆▆▆▆▆▇▇▇          28     0.0%         +9
License              ▇▇▇▇▇▇▅▅▅▅▅▅▅▅▅▅▅▅▅▅▅▅▅▅▅▅          25     0.0%        -12
Plain Text           ▇▇▇▇▇▇▇▇▇▇▇▇▇▇▇▇▇▇▇▇▇▇▇▇▇▇          24     0.0%         +0
───────────────────────────────────────────────────────────────────────────────
Or perhaps you want to calculate the bus factor of your application?
$ scc --by-author
───────────────────────────────────────────────────────────────────────────────
Authors · last 1000 commits · 2019-07-24 → 2026-07-08
───────────────────────────────────────────────────────────────────────────────
Author                               Code     Cmplx   Files     Owns  Last seen
───────────────────────────────────────────────────────────────────────────────
Ben Boyter (github.com)            18,901     1,839      59    37.9% 2026-07-06
apocelipes                         16,740       299      11    33.6% 2026-06-26
Ben Boyter (boyter.org)             6,013       469      19    12.1% 2026-07-04
David Baggerman                       361        26       2     0.7% 2021-03-29
Douglas DeMars                        256         9       0     0.5% 2026-01-06
Daniel                                240         4       0     0.5% 2026-04-30
qwerty8811                            198        24       0     0.4% 2026-03-25
Gaël Selig                            193         0       0     0.4% 2025-06-21
Jan Günter                            182         8       0     0.4% 2021-12-13
Daulet Zhanguzin                      171        23       0     0.3% 2026-05-04
Erik                                   96         2       0     0.2% 2024-10-23
Jeff Foster                            85         0       0     0.2% 2026-01-12
Daniel Poelzleithner                   78         0       0     0.2% 2026-05-04
Richard Simison                        77        16       0     0.2% 2026-04-13
masukomi                               62         0       0     0.1% 2023-01-03
others (80)                         1,272        71       —     2.5%          —
(before window)                     4,960       259       6     9.9%          —
───────────────────────────────────────────────────────────────────────────────
Bus factor 2 · Ben Boyter (github.com) + apocelipes
               last-touched 79% of in-window code
───────────────────────────────────────────────────────────────────────────────
I probably need to setup a succession plan.
Note the duplicate Ben Boyter is due to the use of email to determine who is actually committing with some effort to combine them that clearly is not perfect. Yes it is using .mailmap and yes I accept patches and PR’s.
Or how about both and see who is committing over time,
$ scc --by-author --timeline
───────────────────────────────────────────────────────────────────────────────
Authors · last 1000 commits · 2019-07-21 → 2026-06-26
───────────────────────────────────────────────────────────────────────────────
Author                   Activity                  Commits     Code±
───────────────────────────────────────────────────────────────────────────────
Ben Boyter               ▇▅▂▂▁▂▁▁▂▁▁▁▁▁▁▁▄▁▁▁▁▁▁▂      493    +9,943
Ben Boyter               ▆▇▃▅▃▅▄▄▆▄▂▂▄▄▃▄▆▅▆▃▃▃▃▆      212   +13,848 ↑
apocelipes               ▁▁▁▁▁▁▁▁▁▁▁▁▁▁▁▁▂▆▅▄▆▇▄▅       82   +15,494
David Baggerman          ▇▅▁▁▁▂▁▁▁▁▁▁▁▁▁▁▁▁▁▁▁▁▁▁       32      +451 quiet 63mo
Florian Schäfer          ▁▁▁▁▁▁▁▇▁▁▁▁▁▁▁▁▁▁▁▁▁▁▁▁        9       +43 quiet 56mo
dependabot[bot]          ▁▁▁▁▁▁▁▁▁▅▁▁▇▁▁▁▁▁▇▅▁▅▁▅        6        +0 quiet 1mo
Eli Lindsey              ▇▁▁▁▁▁▁▁▁▁▁▁▁▁▁▂▁▁▁▁▁▁▁▁        5       +20 quiet 31mo
Olivia (Zoe)             ▁▁▁▁▁▇▁▁▁▁▁▁▁▁▁▁▁▁▁▁▁▁▁▁        5       +10 quiet 63mo
Spenser Black            ▁▁▁▁▁▁▁▁▁▁▁▁▁▁▁▁▁▁▇▁▁▁▁▁        5       +23 quiet 20mo
Anthony Mastrean         ▁▁▁▁▁▁▁▁▁▁▁▇▁▁▁▁▁▁▁▁▁▁▁▁        3        -2 quiet 42mo
Loïc Houpert             ▁▁▁▁▁▁▁▁▁▁▁▁▁▁▁▇▁▁▁▁▁▁▁▁        3       +11 quiet 30mo
lhoupert                 ▁▁▁▁▁▁▁▁▁▁▁▁▁▁▁▇▁▁▁▁▁▁▁▁        3        +6 quiet 28mo
neildwu                  ▁▁▁▁▁▁▅▇▁▁▁▁▁▁▁▁▁▁▁▁▁▁▁▁        3       +14 quiet 59mo
Adam Weinberger          ▁▁▁▁▁▁▁▁▁▁▁▁▁▁▇▁▁▁▁▁▁▁▁▁        2       +33 quiet 34mo
Carter Li                ▁▁▁▁▁▁▁▁▁▁▁▁▁▁▁▁▇▁▁▁▁▁▁▁        2       +57 quiet 27mo
───────────────────────────────────────────────────────────────────────────────
Some of you lack commitment!
Infographic
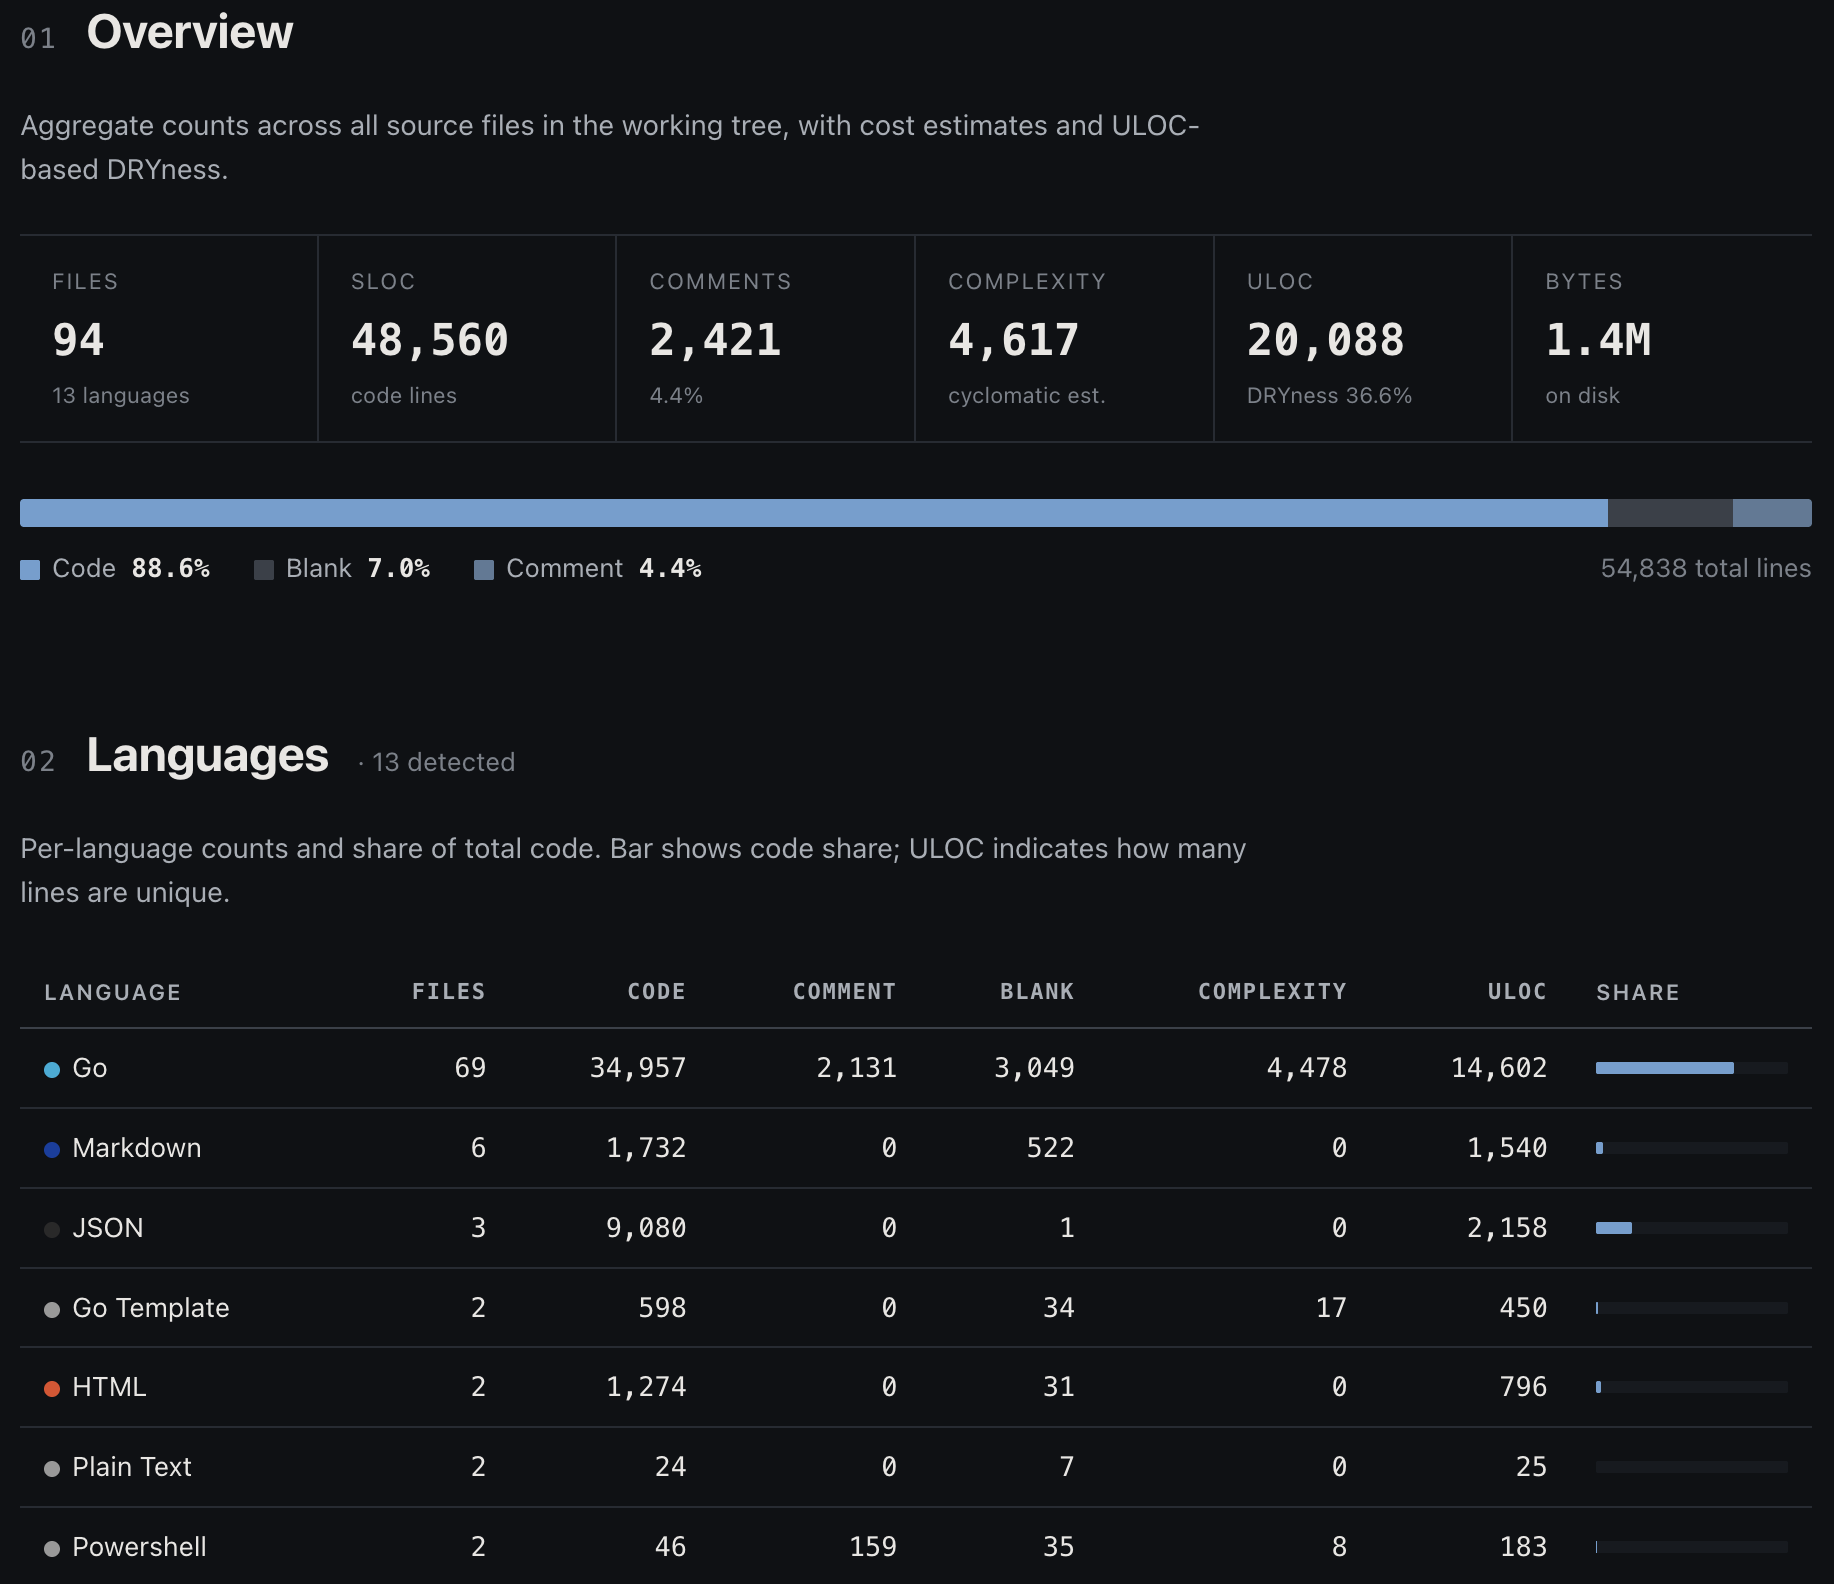
You can now produce an infographic. This builds on the git support now baked into scc, and includes all the metrics you know and love including the new git based ones.
This is what you hand over to management, since they probably don’t want a vi inspired slide deck presentation of the information presented.
$ scc --report
Report written to scc-report.html
The report itself looks a bit like the below, with this being a very limited capture of what you get.
Cognitive Complexity
One of the first things I added into scc was complexity calculations. This was because I missed the cyclomatic complexity calculations that came with Visual Studio Code as a way to know if I was writing things appropriately.
The deeper story is I was trying to estimate a project, and due to not being able to compile (so no cyclomatic complexity), the codebase being too large for cloc to run in an acceptable timeframe, I massively underestimated how long it would take. This burnt me badly and thus I spent the next 7 years building scc to over-correct for my previous failures.

However cyclomatic complexity was invented in 1976 and while I have not found too many improvements on how this is calculated there have been some.
The main one being the one from Sonar which is a tool I’ll be the first to admit not being a huge fan of (subject for another post). However I am not above taking good ideas from wherever I find them. Consider the below examples in Python,
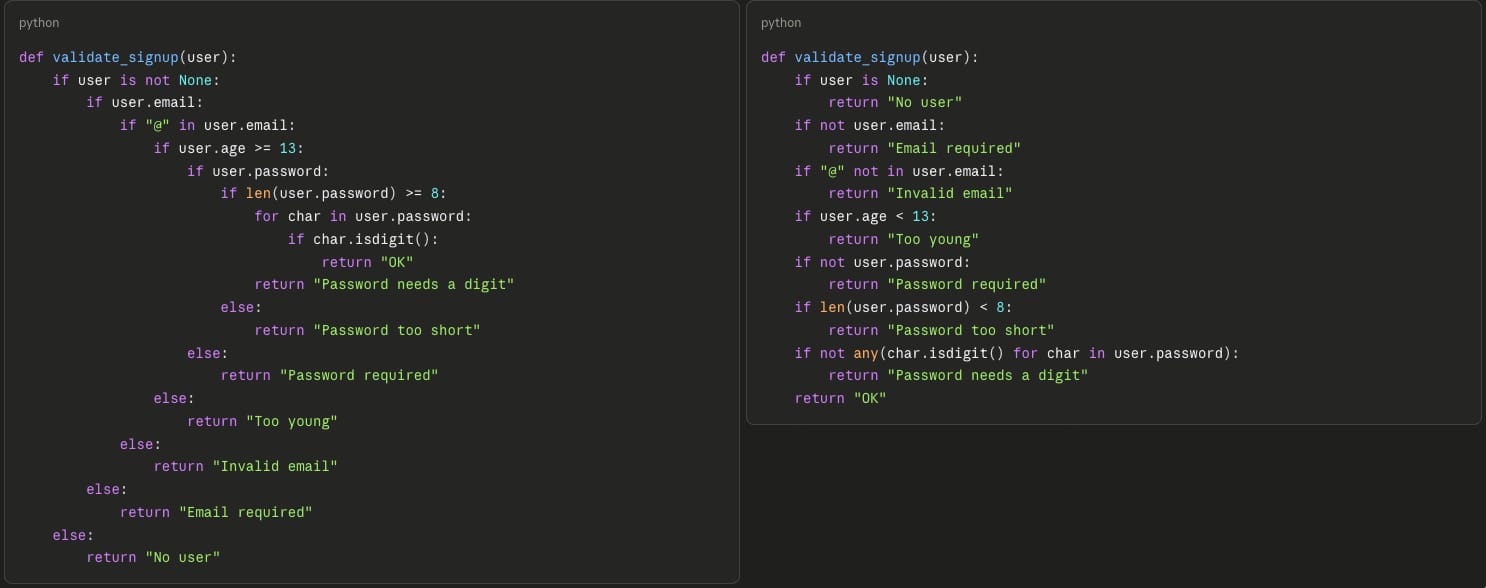
Clearly the left one is going to be harder to maintain since it is not using guard clauses. Similar results, different implementation.
The way that sonar calculates this, is by running a full AST over the code, and where an if condition is found, it can know if it was nested by walking the tree. This isn’t going to fly in scc simply because of the runtime cost to do this. The complexity calculation in scc is already an approximation albeit a close cheaply calculated one.
But the thing that really matters here is not the nesting, it’s the shape of the code. Indentation is a reasonable proxy for complexity, and unless you write code like it’s brainfuck,
++++++++[>++++[>++>+++>+++>+<<<<-]>+>+>->>+[<]<-]>>.>---.+++++++..+++.>>.
In which case I say to you, “Woah calm down over there satan”.
The shape of the code matters more than what those indents actually are. This probably remains true for any linted code and Python, and frankly if you aren’t linting your code I’d like to know why. Regardless try squinting at the code above so the details disappear, and tell me which one you would rather make a production change to. Incidentally this is the same argument that Adam Tornhill made in his book, although he actually blurred the code.
As a result, we can approximate the calculation in scc by simply counting the amount of whitespace, IE spaces and tabs at the beginning of the line and using that as a multiplier for the complexity count. This is a matter of just pushing and popping how nested the current line of code is, and use that as a multiplier when we do hit a branch condition. Reminder that this is an approximation of cognitive complexity, based on how most humans and LLMs write code. There are cases it will not work (although it should fall back to cyclomatic rules in that case).
So whats the cost from a performance point of view? I ran it over my local projects folder to get an idea,
$ hyperfine 'scc' 'scc --cognitive'
Benchmark 1: scc
  Time (mean ± σ):      4.573 s ±  0.047 s    [User: 11.815 s, System: 6.274 s]
  Range (min … max):    4.520 s …  4.658 s    10 runs

Benchmark 2: scc --cognitive
  Time (mean ± σ):      4.583 s ±  0.086 s    [User: 12.069 s, System: 6.188 s]
  Range (min … max):    4.521 s …  4.816 s    10 runs

Summary
  scc ran
    1.00 ± 0.02 times faster than scc --cognitive
Effectively noise. It’s less than 1% which means from a benchmark point of view down to variance in the run more than anything else. It is consistent though, so lets call it a < 1% performance cost. So a reasonable approximation for free from a CPU time point of view.
Whats the impact? What difference do I see enabling this? Well for the main.go file in scc the complexity shoots up. In fact every file will, since there is a multiplier in play, but in theory it should allow you to hone in on those more complex files.
$ scc main.go
───────────────────────────────────────────────────────────────────────────────
Language            Files       Lines    Blanks  Comments       Code Complexity
───────────────────────────────────────────────────────────────────────────────
Go                      1         230        26        43        161         40

...

$ scc --cognitive main.go
───────────────────────────────────────────────────────────────────────────────
Language            Files       Lines    Blanks  Comments       Code Complexity
───────────────────────────────────────────────────────────────────────────────
Go                      1         230        26        43        161        103
I have not set this to be the default calculation in scc at this point, it’s opt in only. I want to evaluate it over more time to ensure it actually improves everything. But if you want it to be the default you could set it via the new Config/Dotfile support, leading us nicely to…
Config/DotFile Support
Something I have wanted in scc for a while now is some form of global config file override. This is now in with v4.0.0.
You can now add a .sccconfig file to your project root, or setup a .sccconfig file wherever you want and set the environment variable SCC_CONFIG_PATH to point at it. I cover this more on the scc README but it works in the same way that ripgrep/bat work with an opts-list. So say you hate the COCOMO calculation, like wide view support and want to ignore node_modules always? You can add a file like the below to do so,
# count the way I like it
--no-cocomo
--exclude-dir node_modules
--format wide
Note that this config file does not allow you to modify scc to write files. Only the CLI argument can do this, preventing someone doing something nefarious.
This should hopefully put to rest the constant requests I get to turn off COCOMO by default.
MCP Support
scc now has built in MCP support. Hooking it up to your LLM of choice locally allows you to have the LLM find the complexity in your codebase and can help save tokens. I know this because searchcode uses it as well to great effect. You can try searchcode now if you want without having to install scc and get most of the benefits for any public code.
I don’t know if MCP is still the future of CLI to LLM integration, but adding it was no great chore and it sits beside the rest of the code so no maintenance overhead. Should it become problematic in the future or MCP dies it can always be removed.
That said I use it now on my own private projects, with codespelunker to great effect.
LOCOMO
I wrote about this previously LOCOMO but you can get scc to predict the costs to rebuild your codebase as is using a LLM now.
Note this is a metric that I made up (maybe this is my own original idea?), but nobody else had one so I thought I’d at least get the ball rolling. If you do know a better way to do this please reach out.
Other Things
Some things worth mentioning, but not worthy of a full subsection.
- Last duplicate flag now wins
scc -i java -i gowill have Go be counted not Java. - Linguist-inspired language detection. Smarter checking for C++/ObjectiveC/C header files.
- Percentage outputs in JSON. For those of you using jq to do things.
- External ignore files via
--ignore-file ~/.config/git/ignore. Works nicely with the config file. - Many small bug fixes, too numerous to mention.
- Some performance tweaks. These are very hard to get in
sccthese days and should not be underestimated. Most of them coming from apocelipes who is an absolute Go machine.
Ze End
Ten years ago I wrote about Google building this idea and giving up on it because nobody found it useful. I still don’t think they were totally wrong, just missing something to dampen the noise and they put it in the wrong place. Point it at a codebase you are trying to grok and it’s far more effective.
So that’s scc 4.0.0. Grab it from GitHub, point --hotspots at something you’ve never seen, and tell me if it sends you to the right files. If not raise an issue. Or don’t. I’m not your supervisor.