Update 2019-03-13
This is now part of a series of blog posts about scc Sloc Cloc and Code which has now been optimised to be the fastest code counter for almost every workload. Read more about it at the following links.
- Sloc Cloc and Code - What happened on the way to faster Cloc 2018-04-16
- Sloc Cloc and Code Revisited - A focus on accuracy 2018-08-28
- Sloc Cloc and Code Revisited - Optimizing an already fast Go application 2018-09-19
- Sloc Cloc and Code a Performance Update 2019-01-09
- Sloc Cloc and Code Badges for Github/Bitbucket/Gitlab
I don’t want to make any false claims about the impact of scc and the blog post about it https://boyter.org/posts/sloc-cloc-code/ but following its release both tokei and loc were updated with impressive performance improvements. In addition a new tool polyglot http://blog.vmchale.com/article/polyglot-comparisons was released which also claimed performance as its main feature. Lastly the tool gocloc https://github.com/hhatto/gocloc appears to be getting updates as well. All good stuff.
I finished that article with what I am now claiming as a prophetic statement,
Of course whats likely to happen now is that either the excellent authors of Tokei, Loc or Gocloc are going to double down on performance or someone else far smarter than I is going to show of their Rust/C/C++/D skills and implement a parser thats much faster than scc with duplicate detection and maybe complexity calculations. I would expect it to also be much faster than anything I could ever produce. It’s possible that Tokei and Loc could run faster already just by compiling for the specific CPU they run on or through the SIMD optimizations that at time of writing are still to hit the main-line rust compiler.
Totally claiming that I called it, at least when regarding performance. All the projects mentioned are getting renewed attention. However it was not Rust/C/C++ or even D that stepped up to be the new tool but polyglot written in ATS which is a language I had never heard of. That said scc is still the only tool with complexity estimates, and the author of tokei at least has explicitly has ruled it out as a change https://github.com/Aaronepower/tokei/issues/237
If my blog post in any way shape or form pushed forward the performance of code counters and resulted in the saving of countless amounts of time around the IT industry I will consider that the highlight of my career thus far.
Of course being the person I am it also means I need to revisit scc and see what I can do to bring it back into contention on the performance front.
I figured that since I was already making changes to improve accuracy https://boyter.org/posts/sloc-cloc-code-revisited/ I would have a poke through the source and see if there were any wins to made on the performance front. One large issue with this was that I spent a great amount of time making scc about as fast as I could the first time around. I seriously doubted when I started if there was going to be many things I missed, which is a naive thing to think.
The quest for more speed
One of the really neat things about Go 1.11 that I discovered is that the web pprof view now supports flame graphs. Flame graphs for those that don’t know show a base from which methods rise (or fall as the Go one is inverted) out of. The wider the base of the flame the more time is spent in that method. Taller flames indicate more method calls, where one method calls another. They give a nice visual overview of where the program is spending its time and how many calls are made.
Candidates for optimization are wide flames, ideally at the tip. As mentioned oddly enough Go’s flame graphs are inverted. Here is what I started with.

On the far right you can see the code which walks the file tree. Next to it is the code which pulls files into memory. To the left of that is the code which processes the files. The methods which process the files take up more room. This indicates that the application is CPU bound, as that method is only invoked when the far right methods have finished their work, and they only deal with getting the files off disk into memory.
One big issue with flame graphs is that if you aren’t calling out to methods it looks rather flat like the above. This is symptomatic of either a very dense method (consider breaking it up) or a very CPU bound method which you can do little about. This can be solved by breaking large methods down into smaller ones, which will produce more tips in the flame graph.
From my previous benchmarks with scc I was aware that the method complexityCount was one of the more painful ones. At the time I managed to get it down to being about as optimal as I thought. However the brilliance of the flame graph is that it makes it easy to see where additional calls are being made and how long it spends in them.
Clicking into that method produced the following.

Interesting. Looks like there is a hash table lookup and if it can be avoided it will shave 6% of the total running time of the application. The offending code is,
complexityBytes := LanguageFeatures[fileJob.Language].ComplexityBytesEvery time the method is called it goes back to the language lookup and looks for the bytes it needs to identify complexity. This method is called a lot, almost every single byte in the file in some cases. If we look this information up once and pass it along to the method we can save potentially thousands of lookups and a lot of CPU burn time. A simple change to implement this and after another test the result looks like the below.

What does this translate to in the real world?
Before
$ hyperfine 'scc redis'
Benchmark #1: scc redis
  Time (mean ± σ):     239.7 ms ±  43.7 ms    [User: 607.0 ms, System: 822.3 ms]
  Range (min … max):   213.0 ms … 327.5 ms
After
$ hyperfine 'scc redis'
Benchmark #1: scc redis
  Time (mean ± σ):     199.7 ms ±  26.1 ms    [User: 608.0 ms, System: 716.6 ms]
  Range (min … max):   180.5 ms … 268.8 ms
Not a bad saving there. Following this easy win I started poking around the code-base and identified some additional lookups and method calls that could be removed. These changes were largely a result of changing the logic to skip whitespace characters which improve accuracy.
The result of the above tweaks was that the complexity calculation inside scc is now calculated almost for free on small code bases and for a 10% time hit on larger ones. Trying it out on the redis code-base on a more powerful machine.
$ hyperfine 'scc redis'
Benchmark #1: scc ~/Projects/redis
  Time (mean ± σ):      93.2 ms ±   5.1 ms    [User: 183.4 ms, System: 398.2 ms]
  Range (min … max):    88.6 ms … 105.2 ms

$ hyperfine 'scc -c redis'
Benchmark #1: scc -c ~/Projects/redis
  Time (mean ± σ):      91.7 ms ±   5.0 ms    [User: 178.1 ms, System: 408.5 ms]
  Range (min … max):    86.9 ms … 102.7 ms
Only 2 ms difference between the run with complexity vs the one without when running against the redis source code. It does give an idea of just how inefficient that lookup was, and how those additional savings helped. So much so that a 100 ms run had no real difference in the runtime. I really did not expect there to be such a massive performance gain that easily.
Moving on. Another thought I had was that the core matching algorithm has a very tight nested loop like so
for match in complexity_checks:
  for char in match
    check if match
Loop in a loop can be a performance problem as I found in a previous play with performance https://boyter.org/2017/03/golang-solution-faster-equivalent-java-solution/ where flattening the loop improved an algorithms performance considerably in both Java and Go.
So I tried flattening the loop. My first candidate to try was the complexity check logic. I turned the following structure which has a nested loop over the items, and then the bytes they have in turn,
[
  "for ",
  "for(",
  "if ",
  "if(",
  "switch ",
  "while ",
  "else ",
  "|| ",
  "&& ",
  "!= ",
  "== "
]
into the following representation,
"for _for(_if _if(_switch _while _else _||_&&_!=_=="
Separated by a null byte separator (represented by _ above). I could then reset the state when that was hit in order to determine if we have a match or not. The loop became similar to the below.
potentialMatch := true
count := 0

for i := 0; i < len(complexity); i++ {
 if complexity[i] == 0 {
  if potentialMatch {
   return count - 1
  }

  // reset stats
  count = 0
  potentialMatch = true
 }

 if index+i >= endPoint || complexity[i] != fileJob.Content[index+i] {
  potentialMatch = false
 }

 count++
}
The theory being that by avoiding the nested loop it should have less bookkeeping to do. We just reset the state when we hit a null byte and continue processing. I was fairly confident that this would produce a meaningful result. A quick benchmark later, with the existing method and the new one.
BenchmarkCheckComplexity-8        3000000        466 ns/op
BenchmarkCheckComplexityNew-8     2000000        699 ns/op
A meaningful result, but not the one I wanted. Turns out that at this small level of nested looping there is no performance to be gained here. In fact in this case the opposite occurred and it actually ran slower. This was especially annoying because any gains here could have been applied universally and would have really helped speed up the hot methods.
Another thought was to do what the complexity check does in the checking for open matches (it finds open comments, strings etc..) and build a small list of the first bytes for each lookup and then loop that to see if we should process any further. As mentioned the complexity check does this and as such it was a fairly simple thing to add, since similar code already existed. Another benchmark later.
github.com/boyter/scc/processor.checkForMatchMultiOpen (15.15%, 0.75s) "with byte check"
github.com/boyter/scc/processor.checkForMatchMultiOpen (12.97%, 0.62s) "without byte check"
Alas the number of bytes to check here is generally too small to make it worthwhile, it ends up doing more work as a result and this does not save any time but actually slows down processing.
At this point I was running out of ideas.
I decided I would have a look at changing the order of the if statements in the different state cases. Due to how they had a bailout condition ideally you want to hit the most common ones first in order to trigger these conditions and avoid additional processing. Note that this is a serious micro optimization. It only makes sense to even consider something like this because the application runs in a very tight loop.
I started tweaking the order of the if conditions in the blank state processor. The results were rather surprising.
$ hyperfine -m 50 'scc cpython'
Benchmark #1: scc cpython
  Time (mean ± σ):     551.7 ms ±  22.5 ms    [User: 1.936 s, System: 1.737 s]
  Range (min … max):   525.1 ms … 636.3 ms

$ hyperfine -m 50 'scc cpython'
Benchmark #1: scc cpython
  Time (mean ± σ):     544.9 ms ±  23.4 ms    [User: 1.904 s, System: 1.808 s]
  Range (min … max):   524.3 ms … 614.6 ms

$ hyperfine -m 50 'scc cpython'
Benchmark #1: scc cpython
  Time (mean ± σ):     536.6 ms ±  10.2 ms    [User: 1.933 s, System: 1.754 s]
  Range (min … max):   516.5 ms … 574.7 ms
I set hyperfine to run 50 times to try and remove any noise from the results and converge on a result. As you can see from the above, changing the if conditions on such a tight loop can actually improve performance quite a bit. In this case the time to process ended up taking ~10 ms less for the best order of the statements I found.
With the blank state sorted I made the change permanent and had a look at the other conditions, starting with multi-line comments.
$ hyperfine -m 50 'scc cpython'
Benchmark #1: scc cpython
  Time (mean ± σ):     540.6 ms ±  20.0 ms    [User: 1.936 s, System: 1.825 s]
  Range (min … max):   515.4 ms … 607.9 ms

$ hyperfine -m 50 'scc cpython'
Benchmark #1: scc cpython
  Time (mean ± σ):     527.1 ms ±   9.5 ms    [User: 1.899 s, System: 1.793 s]
  Range (min … max):   502.6 ms … 577.8 ms
Another small gain of almost ~10 ms from re-ordering the if statements. I then moved to the last state that with if conditionals, the code state. This state is where the application spends most of its time so any wins here are likely to yield the biggest benefits.
Benchmark #1: scc cpython
  Time (mean ± σ):     522.9 ms ±   9.3 ms    [User: 1.890 s, System: 1.740 s]
  Range (min … max):   510.1 ms … 577.7 ms

$ hyperfine -m 50 'scc cpython'
Benchmark #1: scc cpython
  Time (mean ± σ):     491.0 ms ±  10.2 ms    [User: 1.628 s, System: 1.763 s]
  Range (min … max):   476.3 ms … 539.5 ms
Since this is where the application spends most of its time it does indeed give the biggest gain with about 30 ms of time shaved from the previous result.
The final result of reordering the if statements? About 50 ms of processing time for the repository I chose which is almost a 10% processing time saving. For tight loops messing around with the order of if statements can produce results.
The last idea I had to improve performance involved rethinking the problem. We know ahead of time which characters could cause a state change as we know which strings would cause a state change. If the character we are currently processing is the same as the first character of one of those strings then we know we need to continue to check if the state will change. However if it does not match then we can skip any conditional state change logic and just move to the next byte.
In short instead of looking for positive matches assuming they may be there, check quickly if there might be one and if not move on. This is similar to the complexity check logic I had previously added which improved performance by speeding up the best best case at the expense of selling out the worst case.
Logically this makes sense. After all we spend most of the loop not moving between states. So why bother checking if we should move state and instead check if we shouldn’t? In theory it should be less processing. Even if we only do this check inside the check code state there is potentially a massive gain here.
Mercifully this was a quick thing to implement as it is very similar to the complexity check shortcut that is already in the code-base.
$ hyperfine -m 50 'scc cpython'
Benchmark #1: scc cpython
  Time (mean ± σ):     535.3 ms ±   8.0 ms    [User: 1.974 s, System: 1.751 s]
  Range (min … max):   525.1 ms … 575.6 ms

$ hyperfine -m 50 'scc cpython'
Benchmark #1: scc cpython
  Time (mean ± σ):     461.6 ms ±  11.0 ms    [User: 1.310 s, System: 1.890 s]
  Range (min … max):   445.3 ms … 519.8 ms
The result is not a bad one at all. In fact this was a very large performance gain vs the amount of work required.
I then started thinking about the problem some more. The following struck me after a good nights sleep and walking in a park.
The application as written has a main loop which processes over every byte in the file. It keeps track of the state it is in and uses a switch over that state to know what processing should happen. I was wondering if rather than having a large single loop over the whole byte array, what if when we entered a new state we started a new loop which processed bytes until the state changed or we hit a newline? That is, rather than loop and check the state, change state and then loop. Would this be faster?
In effect the loop structure of
for byte in file
  switch
    code state
      process
    blank state
      process
    comment state
      process
becomes
for byte in file
  switch
    code state
      loop bytes
        process
    blank state
      loop bytes
        process
    comment state
      loop bytes
        process
This seems counter intuitive at first because it introduces a loop in loop, but because each of the state loops would be very tight it would mean that the looping code would be much shorter. In theory this increases the chance that the loops spend time faster CPU caches. It also has the added benefit of improving the visibility of the flame graph as each state loop can more easily be pulled out into another method.
After implementing the flame graph looks like the below,

And the new profile output,
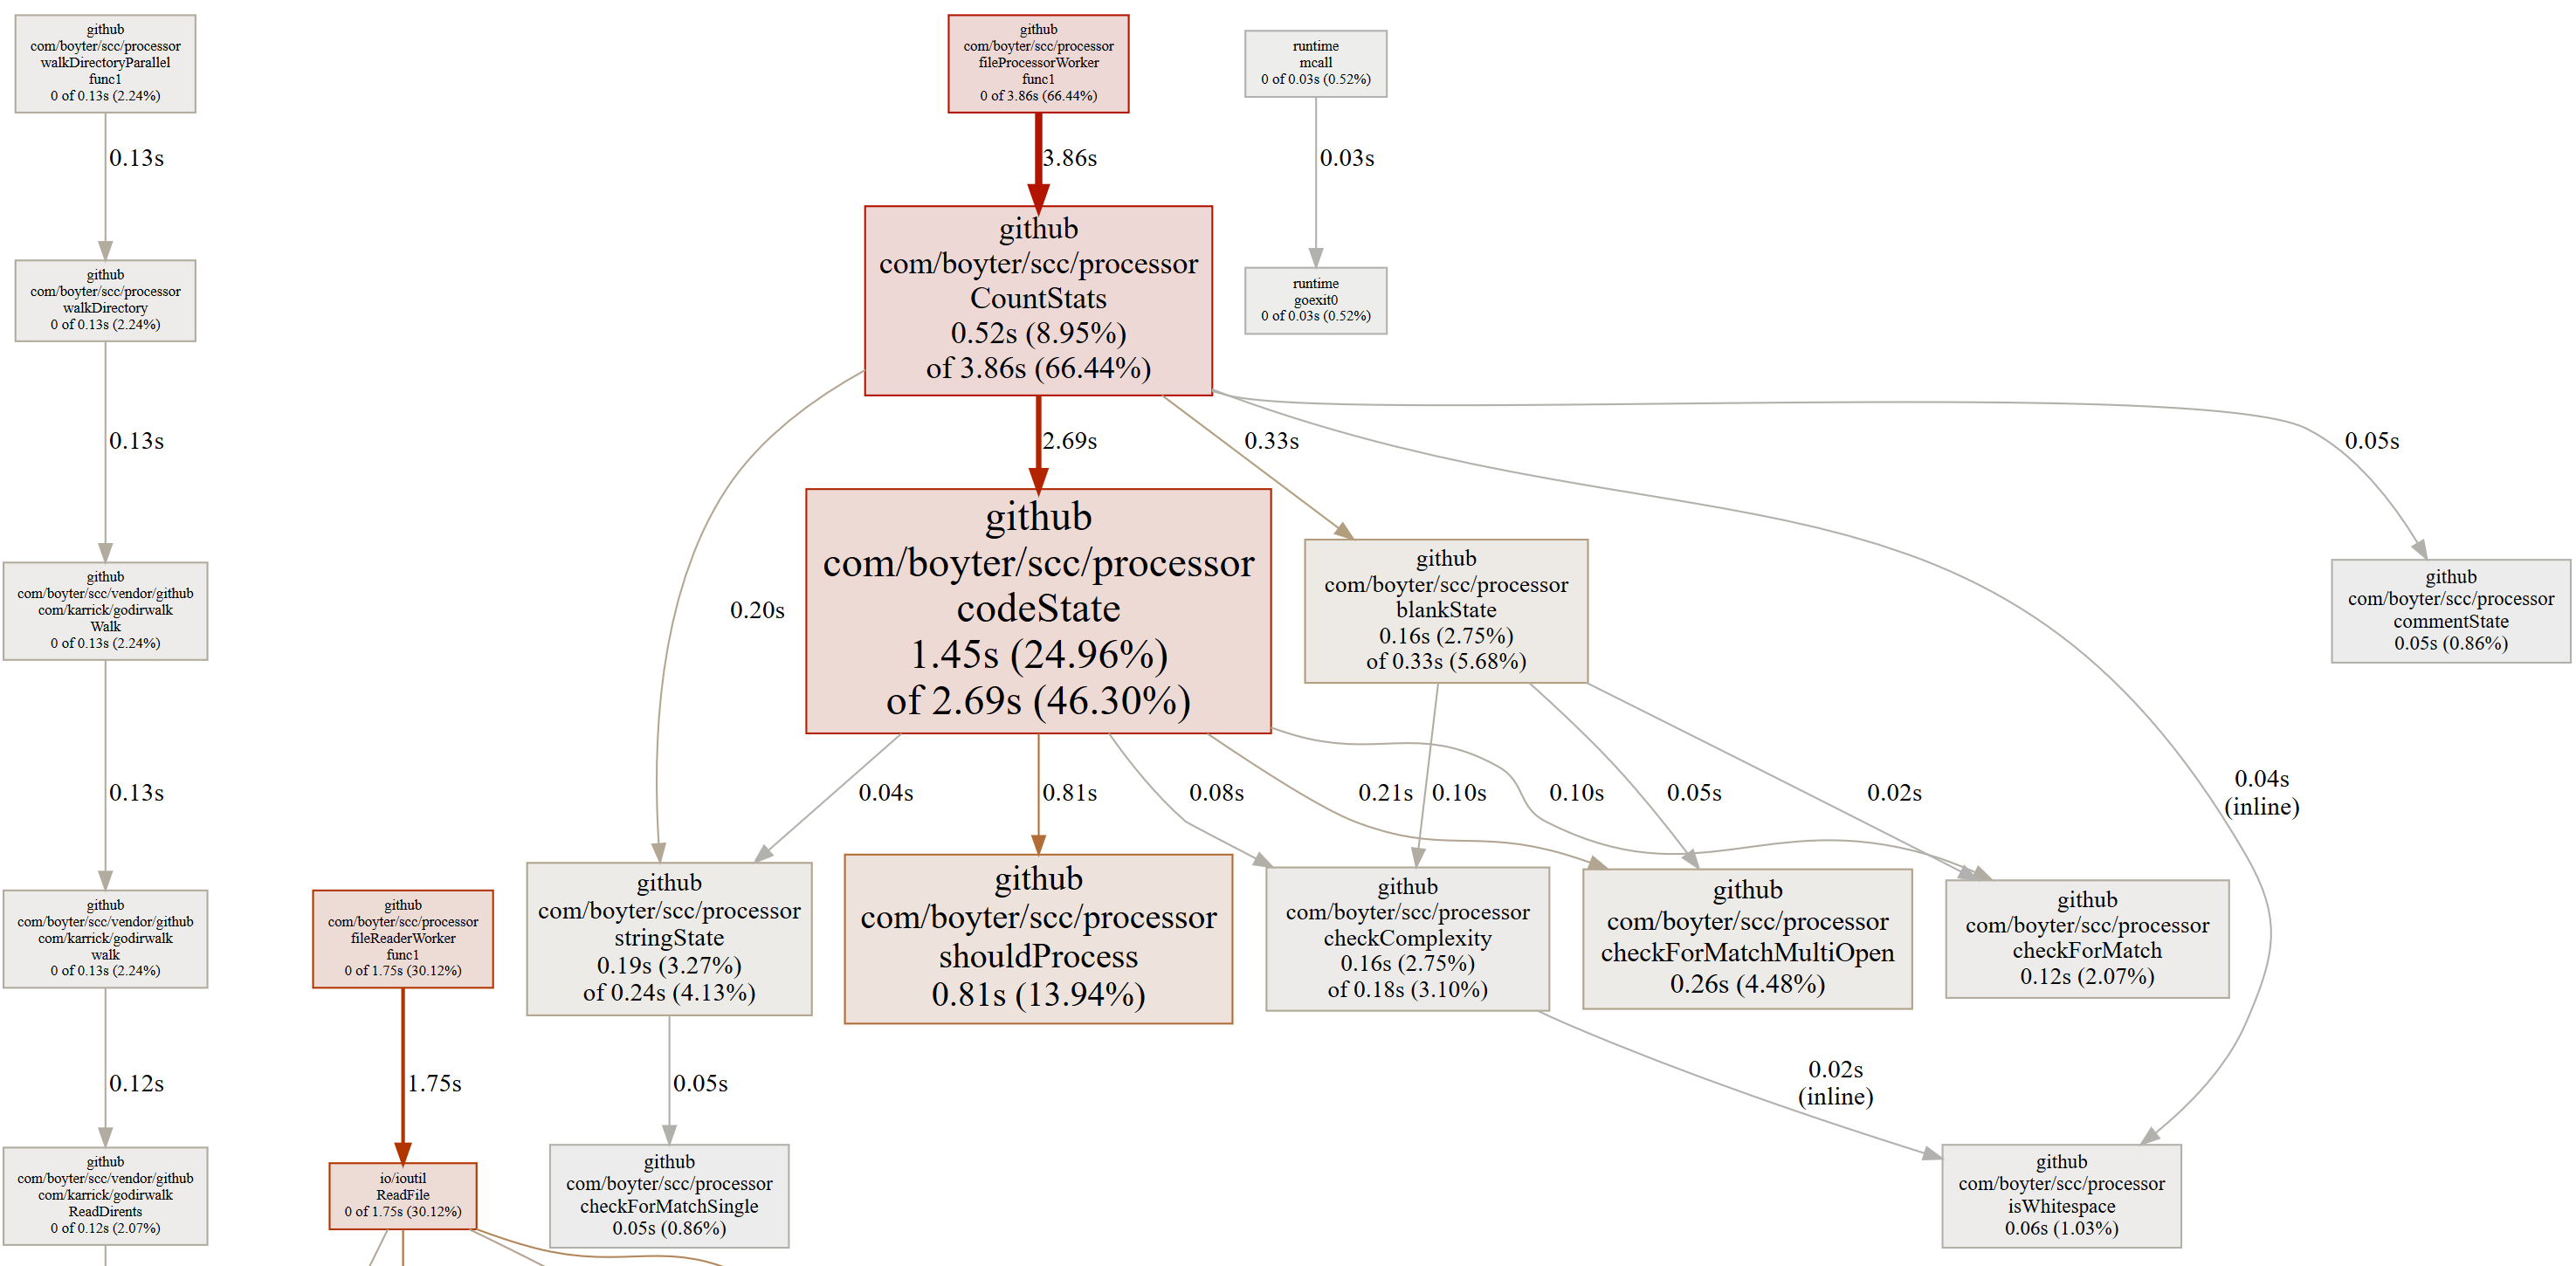
Both of which suggest that the shouldProcess method is our next target. More importantly is what affect has this has on the core loop. I took version 1.9.0 of scc and tried it out against the current branch version on the Linux kernel.
Benchmark #1: ./scc1.9.0 linux
  Time (mean ± σ):      2.343 s ±  0.097 s    [User: 27.740 s, System: 0.868 s]
  Range (min … max):    2.187 s …  2.509 s

Benchmark #1: ./scc linux
  Time (mean ± σ):      1.392 s ±  0.019 s    [User: 19.415 s, System: 0.825 s]
  Range (min … max):    1.367 s …  1.430 s
Wow! Almost a 50% reduction in the time to run. Pretty clearly that guess about moving to tighter loops worked. If you have a look at the original flame graph you can see that the CountStats method which ideally should be calling other methods has a large empty bar on its right side. This has shrunk with the above change. This suggests that even though this method should have been spending all its time processing state changes through methods checkForMatchMultiOpen checkComplexity isWhitespace checkForMatchSingle checkForMatch it was actually spending most of its time processing the loop. By breaking it into smaller tight loops it spends less time in this state, which speeds everything up.
I was about to call it a day at this point when a colleague David https://github.com/dbaggerman raised a very interesting PR which promised to improve performance even more. He implemented something I should have considered a long time ago, bit-masks.
Thats right bit-masks. How in the heck of all thats holy did I forget bit-masks. The only explanation I can come up with is that for day to day programming I have needed bit-masks exactly 0 times. My day job is usually writing web API’s where the network is by far the largest bottleneck. That said I still should have considered this, and frankly I am a little ashamed I did not.
His use of bit-marks as a bloom filter was an especially neat application though.
A few PR fixes later and boom another performance gain. It also allowed me to simplify the code considerably further. I swapped over all the checks that were working against the first byte for bit-marks, and suddenly one of the most expensive methods I added shouldProcess was optimized away.
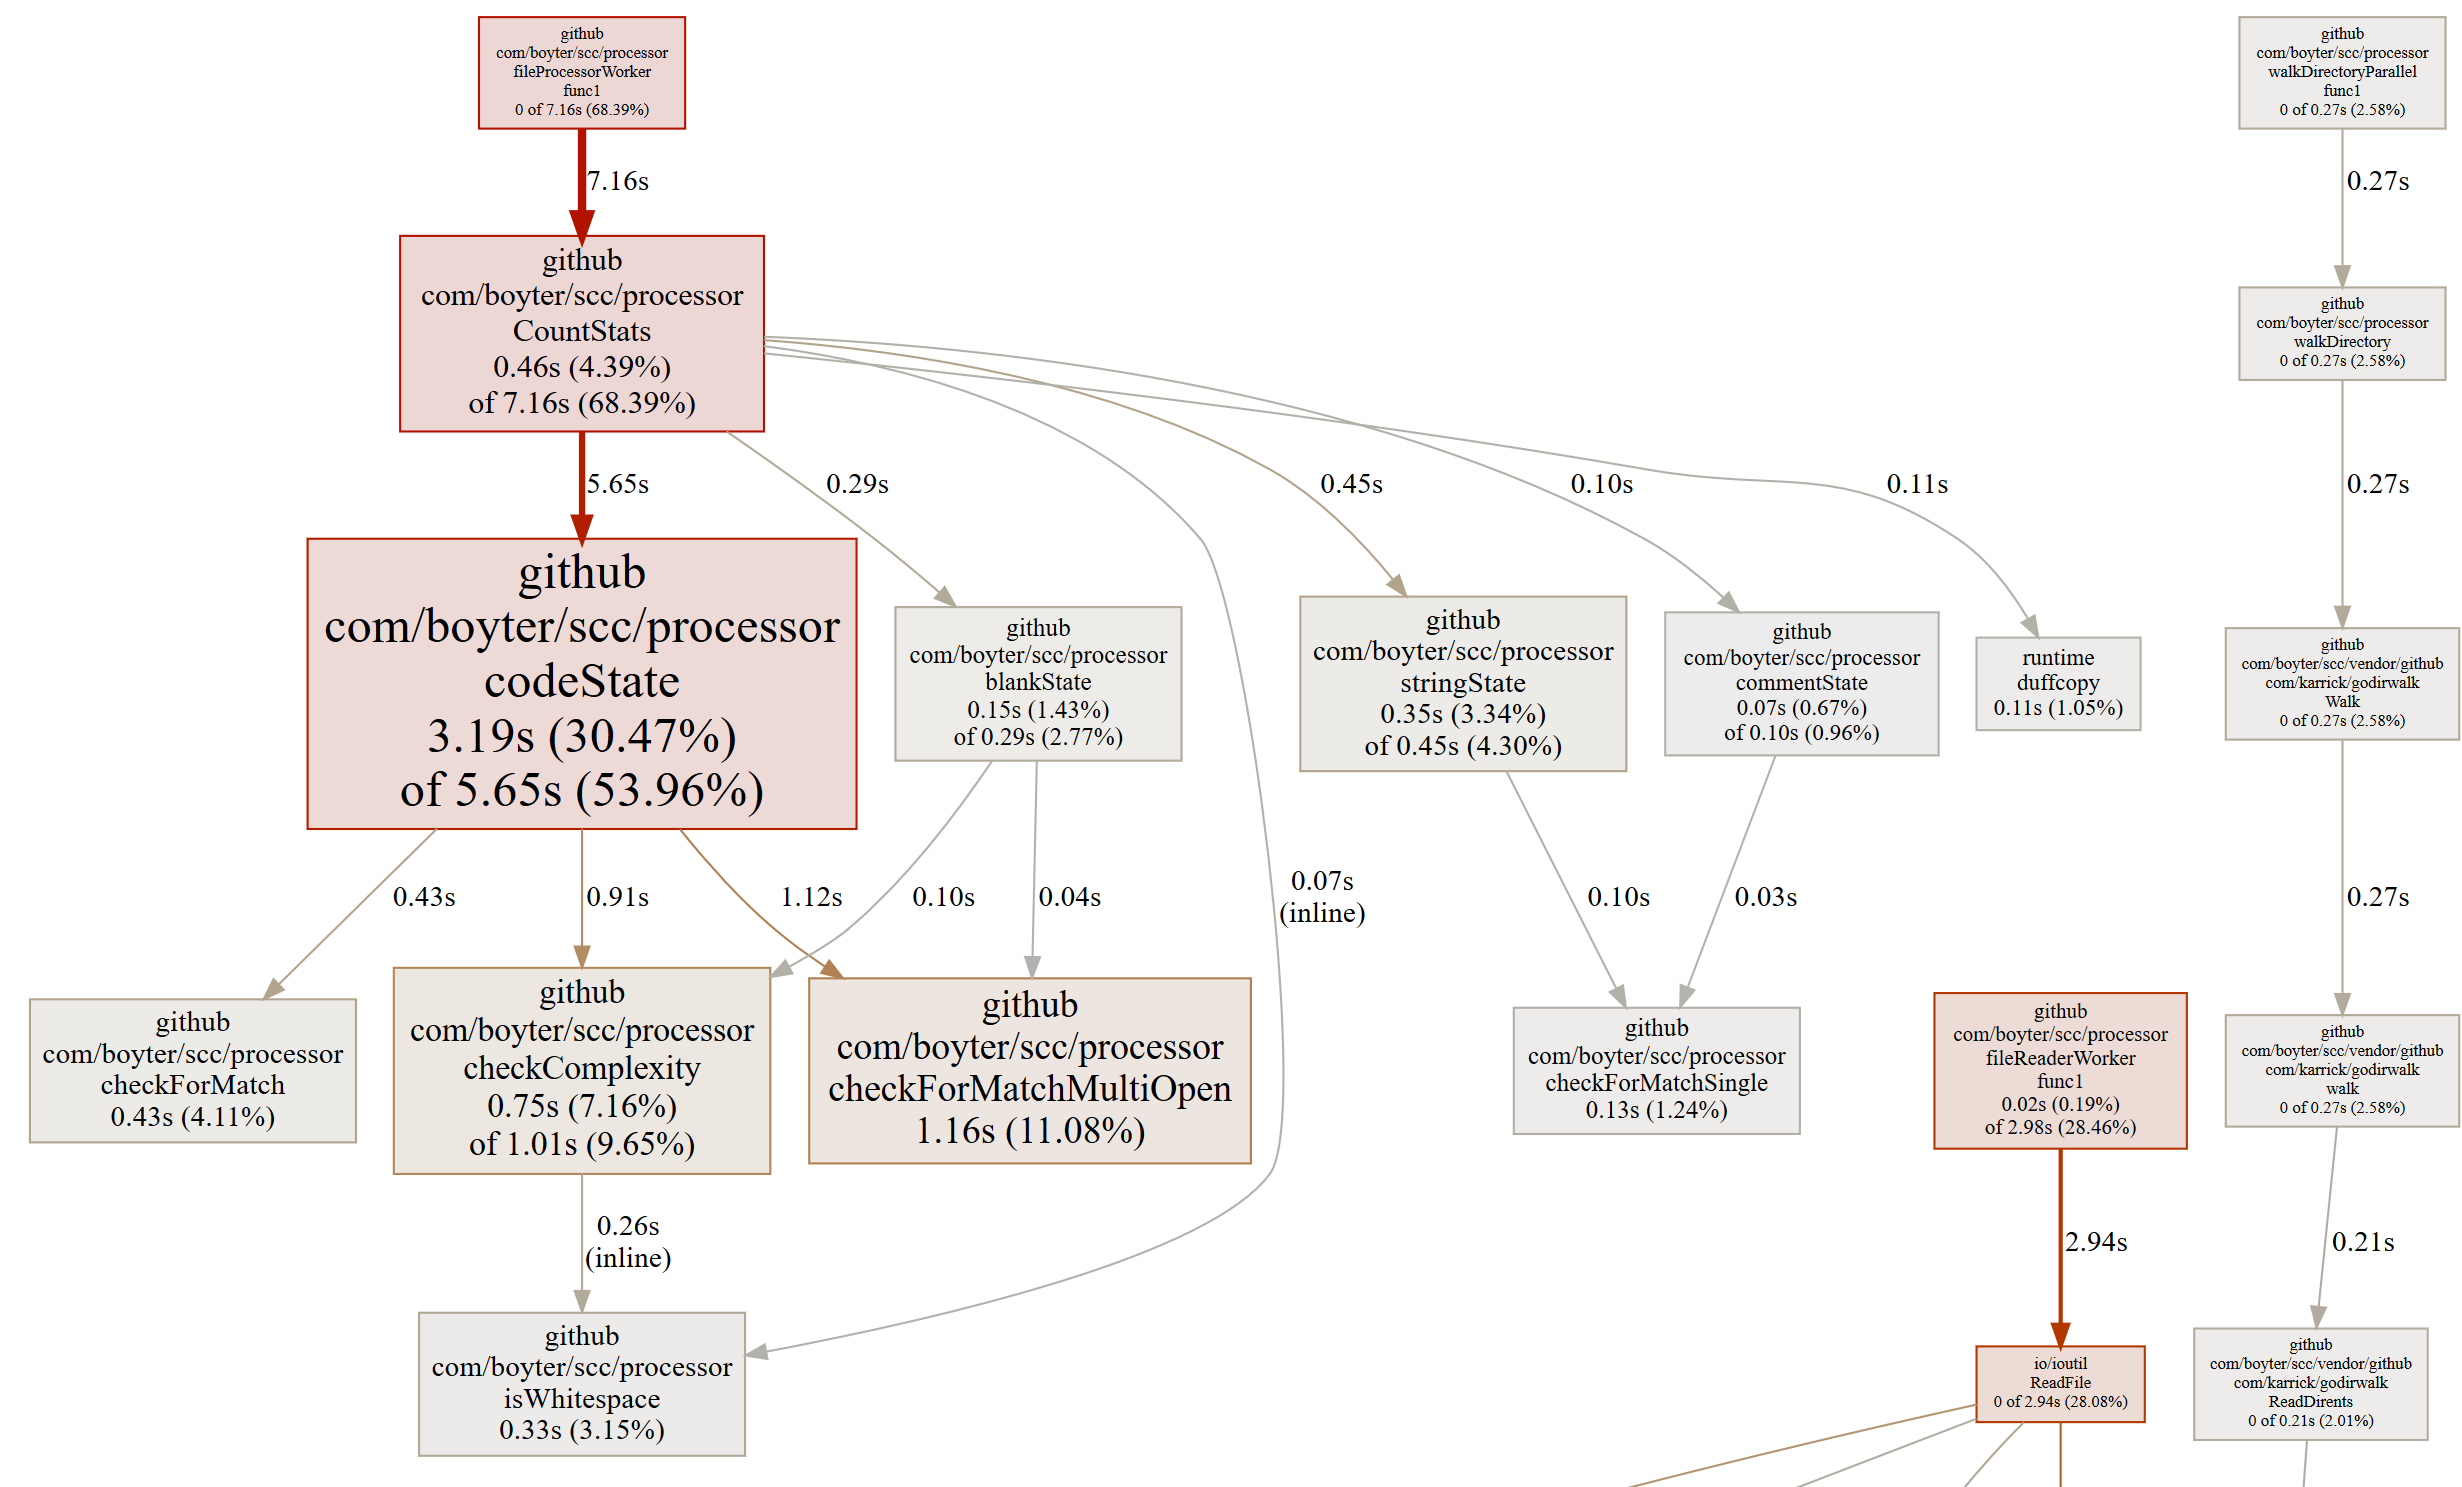
Another very nice thing David raised was that there was contention for the number of go-routines launched when walking the file system https://github.com/boyter/scc/pull/31 and he graciously supplied a very nice nice patch which resolved the issue. It also had the nice benefit of reducing load on the go-routine scheduler which translated into some additional speed.
- linux-4.19-rc1 on a 4 core c5.xlarge:
before: Time (mean ± σ):      4.680 s ±  0.727 s    [User: 17.920 s, System: 0.632 s]
after:  Time (mean ± σ):      4.532 s ±  0.005 s    [User: 17.340 s, System: 0.705 s]
The above made me think about the core loop as well It operates using a switch statement. A bit of searching about how Go optimise’s switch statements turned up the following by Ken Thomson https://groups.google.com/forum/#!msg/golang-nuts/IURR4Z2SY7M/R7ORD_yDix4J
jump tables become impossible. also note that go switches are different than c switches. non-constant cases have to be tested individually no matter what.
Interesting. This means it might be possible to convert the switch over to just if/else statements or to a map of function and get some more speed. Alas trying this locally keep running into CPU throttling issues.
I tried with an if statement against the Linux kernel on fresh virtual machine,
Benchmark #1: ./scc-switch linux
  Time (mean ± σ):      3.278 s ±  0.012 s    [User: 24.999 s, System: 0.784 s]
  Range (min … max):    3.258 s …  3.293 s

Benchmark #1: ./scc-if linux
  Time (mean ± σ):      3.288 s ±  0.016 s    [User: 25.085 s, System: 0.788 s]
  Range (min … max):    3.271 s …  3.321 s
Which worked out to be slightly worse with the if statements. Hence I stuck with the switch. However it may be possible to change the switch to a map and as a result make things a little faster still. Something to consider in the future.
Thinking what else could possibly speed things up David submitted yet another PR https://github.com/boyter/scc/pull/33 with something I had considered a while back and discarded for one reason or another which was using a trie structure to determine if there is a match or not. His implementation was better than mine and it looked like he was getting about a 15% speedup on some processes.
I won’t insult your intelligence by describing what a trie is, but here is a link if you need additional context https://en.wikipedia.org/wiki/Trie
Once nice thing about the trie is that because of how it works you can remove the bit-mask checks entirely, which means potentially less processing, and a faster program.
The PR came with some timings.
4 cores, master: Time (mean ± σ): 6.360 s ± 0.007 s [User: 24.677 s, System: 0.679 s]
4 cores, tries: Time (mean ± σ): 5.489 s ± 0.008 s [User: 21.145 s, System: 0.690 s]

8 cores, master: Time (mean ± σ): 3.217 s ± 0.005 s [User: 24.840 s, System: 0.708 s]
8 cores, tries: Time (mean ± σ): 2.784 s ± 0.005 s [User: 21.270 s, System: 0.733 s]

16 cores, master: Time (mean ± σ): 1.660 s ± 0.016 s [User: 24.936 s, System: 0.778 s]
16 cores, tries: Time (mean ± σ): 1.446 s ± 0.014 s [User: 21.378 s, System: 0.801 s]
I merged the change in and started verifying. Sadly at first I noticed that the results were inconsistent.
For example, the non trie version
$ hyperfine 'scc -c ~/Projects/cpython'
Benchmark #1: scc -c ~/Projects/cpython
  Time (mean ± σ):     481.4 ms ±  18.4 ms    [User: 1.100 s, System: 2.306 s]
  Range (min … max):   467.8 ms … 518.9 ms
vs trie version
$ hyperfine 'scc -c ~/Projects/cpython'
Benchmark #1: scc -c ~/Projects/cpython
  Time (mean ± σ):     526.2 ms ±  14.5 ms    [User: 1.334 s, System: 2.235 s]
  Range (min … max):   502.6 ms … 560.8 ms
However thinking about how the application works. As mentioned before it spends most of its time not moving state. As such you want to identify this state as quickly as possible, even if it means redoing work when you do need to move. Putting the bit-mask back in for just the code state calculations,
$ hyperfine 'scc -c ~/Projects/cpython'
Benchmark #1: scc -c ~/Projects/cpython
  Time (mean ± σ):     505.2 ms ±  14.1 ms    [User: 1.034 s, System: 2.401 s]
  Range (min … max):   490.1 ms … 536.4 ms
Seems its worth keeping the bit-mask checks, at least for the hotter methods. However David had other ideas, and instead split out the trie similar to how the the bit-masks had worked so that they were more targeted per state. Following a merge,
$ hyperfine 'scc -c ~/Projects/cpython'
Benchmark #1: scc -c ~/Projects/cpython
  Time (mean ± σ):     430.6 ms ±  25.0 ms    [User: 554.5 ms, System: 2327.7 ms]
  Range (min … max):   417.8 ms … 500.7 ms
And now we are faster again for every repository I tried.
In addition a nice pickup by Jeff Haynie https://github.com/jhaynie came through in a PR https://github.com/boyter/scc/pull/35 managed to remove some pointless allocations which should help performance just that little bit more. I suspect that this is more an issue for him as he is using scc in a long lived process but every little bit helps.
One thing I had identified in my original post about scc was that the Go garbage collector was a hindrance to performance. I had also tried turning it off with bad results on machines with less memory. As such I took a slightly different approach. By default scc turns the garbage collector off, and if by default 10000 files are parsed then it is turned back on. This results in a nice speed gain for smaller projects. Of course this did result in a bug https://github.com/boyter/scc/issues/32 where the GC gettings leaked out, but thankfully Jeff picked this one up as well and I modified the source to ensure that the scope was limited to the scc main function.
I really wish Go would allow you to configure the GC to be throughput focused rather than latency focused. Seeing as this is possible in Java I imagine it might happen eventually.
One annoying thing that comes out of the very tight benchmarks posted is that scc spends a non trivial amount of time parsing the JSON it uses for language features. For example over a few runs with the trace logging enabled I recorded the following,
TRACE 2018-09-14T07:20:21Z: milliseconds build language features: 42
That is 40 milliseconds spent every time scc is called just getting ready to parse. The most annoying part is that it gets worse with slower CPU’s or if you CPU is being throttled for some reason.
The entire step can actually be removed into a pre-process step of go generate and shave the time of every call to scc by a few milliseconds for each run.
Of course this means a non trivial change to how the task in go generate works, but I think the result is potentially worth it in the future and something I will consider. I like the way it currently works because it allows the rapid iteration that allowed bit-mask checks and trie’s to be implemented rapidly.
The result of all of the above? It now appears that scc is almost not bottlenecked by CPU anymore but by reading files off disk, at least on my development machine where I created this graph.

The CPU flame is almost the same width as the disk access. This is an excellent result from where it started. It also means scc is getting to the point where there is little reason to investigate additional CPU savings (I will still take them if they come up of course!).
The big question though. With all of the above tweaks is scc able to pick the performance that tokei, loc and polyglot are throwing down?
Benchmarks
All GNU/Linux tests were run on Digital Ocean 32 vCPU Compute optimized droplet with 64 GB of RAM and a 400 GB SSD. The machine used was doing nothing else at the time and was created with the sole purpose of running the tests to ensure no interference from other processes. The OS used is Ubuntu 18.04 and the rust programs were installed using cargo install. The programs scc and polyglot were downloaded from github and gocloc was compiled locally and pushed onto the server.
I am not running benchmarks on Windows or macOS this time but when I tried them out the results were similar.
With that out of the way time for the usual benchmarks. Similar to the comparison by tokei https://github.com/Aaronepower/tokei/blob/master/COMPARISON.md I have included a few tools, tokei, cloc, scc, loc and polyglot.
Tools under test
- scc 1.10.0
- tokei 8.0.0
- loc 0.5.0
- polyglot 0.5.13
- gocloc b3aa5f37096bbbfa22803a532214a11dbefa0206
I compiled tokei and loc on the machine used for testing using the latest version of Rust 1.29.
I am not going to include any commentary about the benchmarks.
To start lets try the accuracy test using the tokei torture test file https://github.com/Aaronepower/tokei/blob/master/COMPARISON.md#accuracy with the correct result being 1 file, 38 lines, 32 code lines, 2 comments and 5 blank lines.
root@ubuntu-c-32-sgp1-01:~# ./scc tokeitest/
-------------------------------------------------------------------------------
Language                 Files     Lines     Code  Comments   Blanks Complexity
-------------------------------------------------------------------------------
Rust                         1        38       32         2        4          5
-------------------------------------------------------------------------------

root@ubuntu-c-32-sgp1-01:~# tokei tokeitest/
--------------------------------------------------------------------------------
Language             Files        Lines         Code     Comments       Blanks
--------------------------------------------------------------------------------
Rust                     1           38           32            2            4
--------------------------------------------------------------------------------

root@ubuntu-c-32-sgp1-01:~# loc tokeitest/
--------------------------------------------------------------------------------
Language             Files        Lines        Blank      Comment         Code
--------------------------------------------------------------------------------
Rust                     1           38            4           34            0
--------------------------------------------------------------------------------

root@ubuntu-c-32-sgp1-01:~# cloc tokeitest/
github.com/AlDanial/cloc v 1.74  T=0.01 s (127.5 files/s, 4974.4 lines/s)
-------------------------------------------------------------------------------
Language                     files          blank        comment           code
-------------------------------------------------------------------------------
Rust                             1              4             10             24
-------------------------------------------------------------------------------
root@ubuntu-c-32-sgp1-01:~# ./polyglot tokeitest/
-------------------------------------------------------------------------------
Language             Files       Lines         Code     Comments       Blanks
-------------------------------------------------------------------------------
Rust                     1          38           34            0            4
-------------------------------------------------------------------------------
As you can see both tokei and scc get the numbers correct. The other tools have varying degrees of success.
A Fair Benchmark
Finding a fair benchmark is hard.
For code counters ideally what we want to test is the core loop of the application. However this means both tokei and scc are at a disadvantage as they both check the presence of strings which neither loc nor as far as I can tell polyglot do. Its also an issue for any random project because loc and scc both count JSON files while tokei and polyglot do not. This gets worse when you consider other language types as none of the tools share the same language definitions. Some tools check recursively for git-ignore files, some have deny-lists, some have duplicate detection, some have checks for binary files, and the list goes on. It’s also a little bit harder for scc as it attempts to perform complexity estimates.
The result is that every tool over any random project is doing different amounts of work. As such I decided to create a totally artificial test, for which every tool under test produces the exact same result. This way each tool is has the same number of bytes they need to process to produce the same output. In theory this means we are benchmarking fairly between each and the differences should come down to how they walk the file system and the algorithm used in the core loop.
To create this situation I picked the language Java (which all tools support) and used a modified file based on https://github.com/boyter/java-spelling-corrector/blob/master/src/com/boyter/SpellingCorrector/SpellingCorrector.java which is a Java spell-check class I wrote some time back.
The file I am testing 150 lines in length with 117 lines of code, 0 comments and 33 blank lines. I picked it because it represents a reasonable file length and for the above every tool the code produced the same result. I will mention that polyglot was especially troublesome in this regard as it was the one that produced incorrect results most of the time. The version I was using appears to not count comment lines correctly and in the case of Python appeared to always ignore the first # comment for every file. I stripped out all comments in order for it to pass. Once done I re-purposed my script which create directories of different depths with files.
https://github.com/boyter/scc/blob/master/examples/create_performance_test.py
With that done I was able to run each of the code counters in what hopefully is a fair way, by just pointing them at the root of the large directory tree which should produce the same results for every tool. The point of this is not to pick on any single counter, but instead to discover how fast the core counter and the file reading is with all other portions being as equal as possible.
I should note, that as far as I am aware none of the counters under test have any logic to explicitly deal with the above artificial test and as such are not able to game it to achieve a higher score.
Lastly for all test I have run scc with and without the complexity calculations in an attempt to show that there is almost no cost running them in scc and to keep the playing field as fair as possible. It is important to show how the applications perform without tweaks, but also to try and provide an apples to apples comparison.
For real world projects, I picked the same ones used on the tokei comparison page, but rather then using the unreal engine (which I don’t want to sign up to download) I swapped that out for the linux kernel.
Artificial
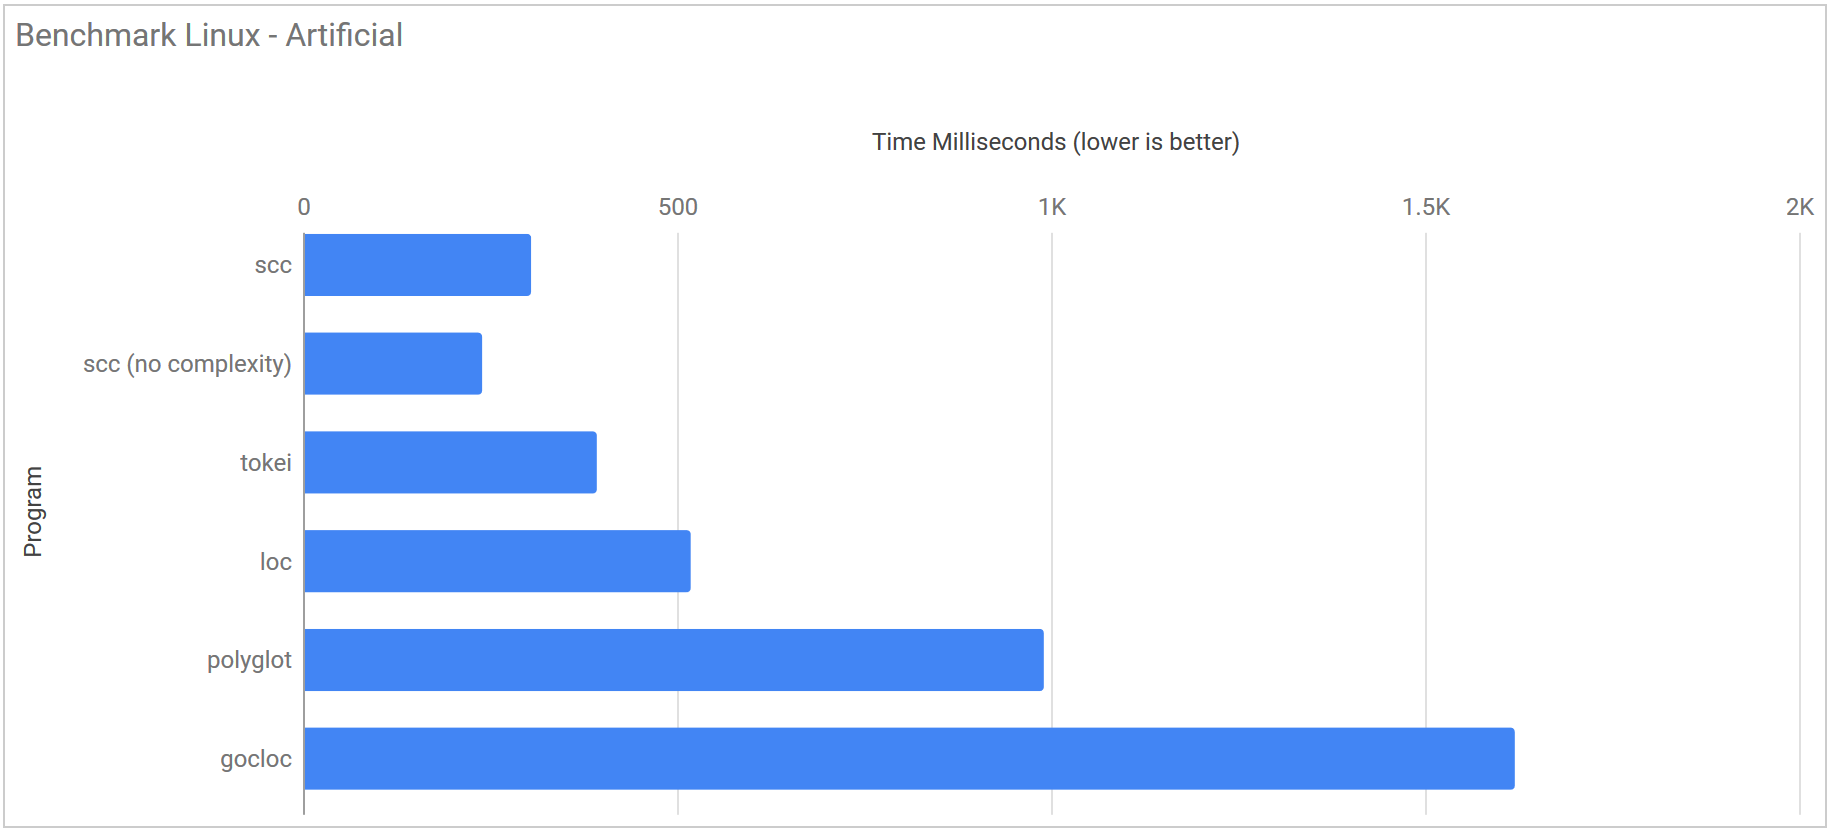
This is the purely artificial benchmark I discussed above. Each of the 8 directories is created in a sub-folder which then had each application run against it.
| Program | Runtime |
|---|---|
| scc | 304.9 ms ± 15.8 ms |
| scc (no complexity) | 239.4 ms ± 8.7 ms |
| tokei | 392.8 ms ± 12.9 ms |
| loc | 518.3 ms ± 130.2 ms |
| polyglot | 990.4 ms ± 31.3 ms |
| gocloc | 1.620 s ± 0.010 s |
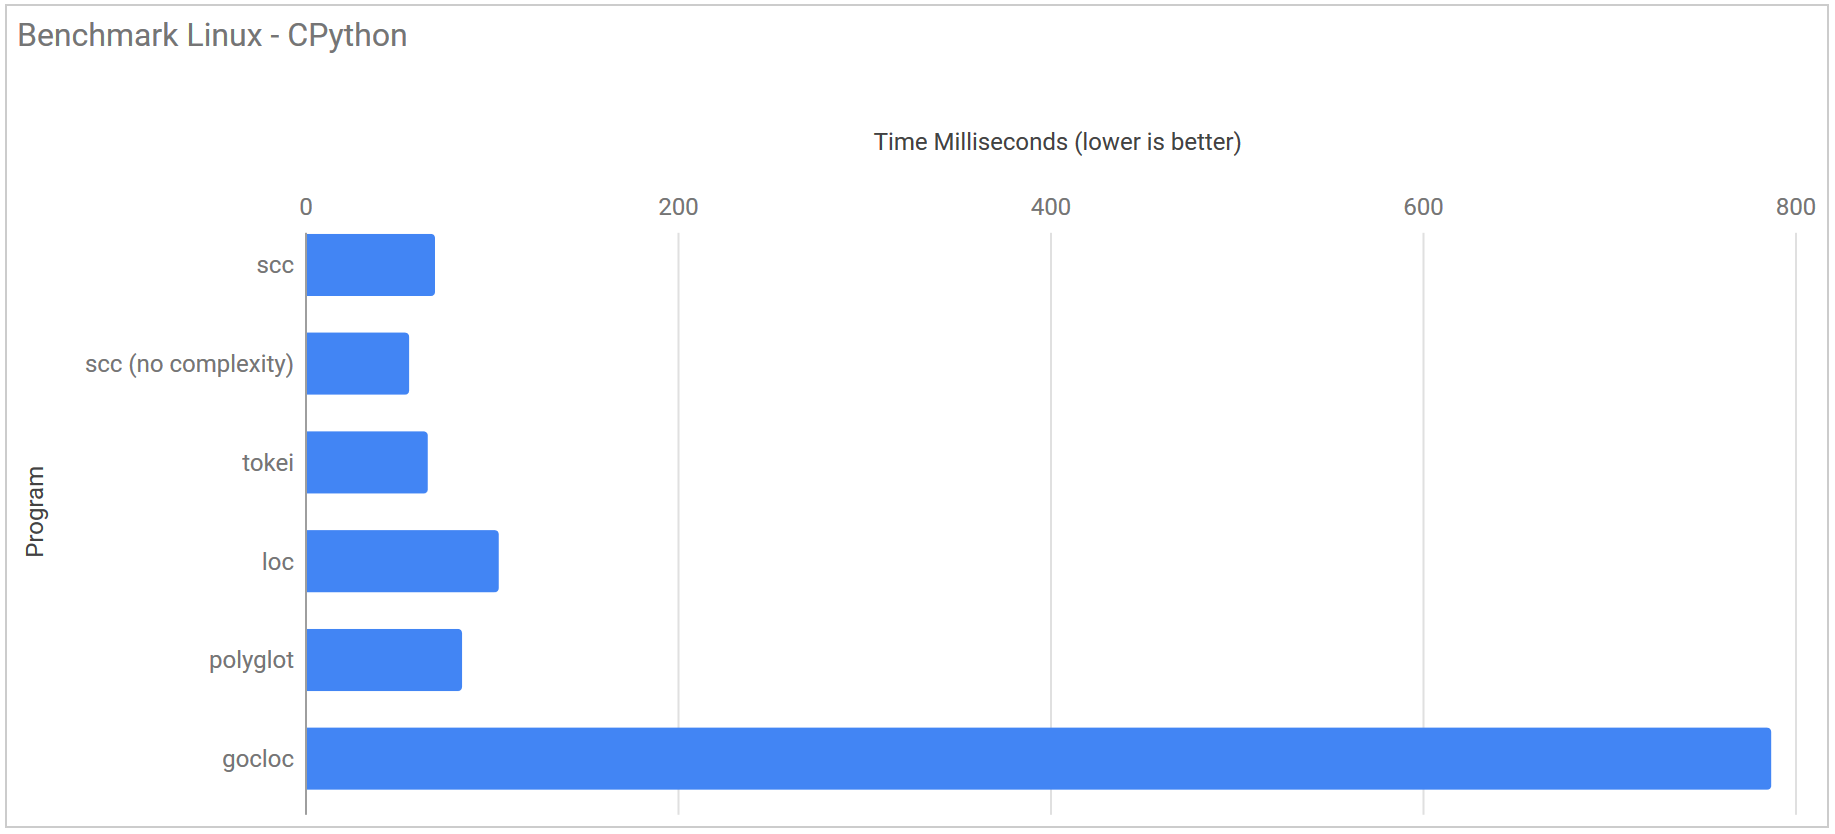
Cython commit 471503954a91d86cf04228c38134108c67a263b0
| Program | Runtime |
|---|---|
| scc | 69.8 ms ± 2.7 ms |
| scc (no complexity) | 55.9 ms ± 2.6 ms |
| tokei | 65.9 ms ± 6.4 ms |
| loc | 104.0 ms ± 58.4 ms |
| polyglot | 84.3 ms ± 8.4 ms |
| gocloc | 787.2 ms ± 7.1 ms |
Redis commit 7cdf272d46ad9b658ef8f5d8485af0eeb17cae6d
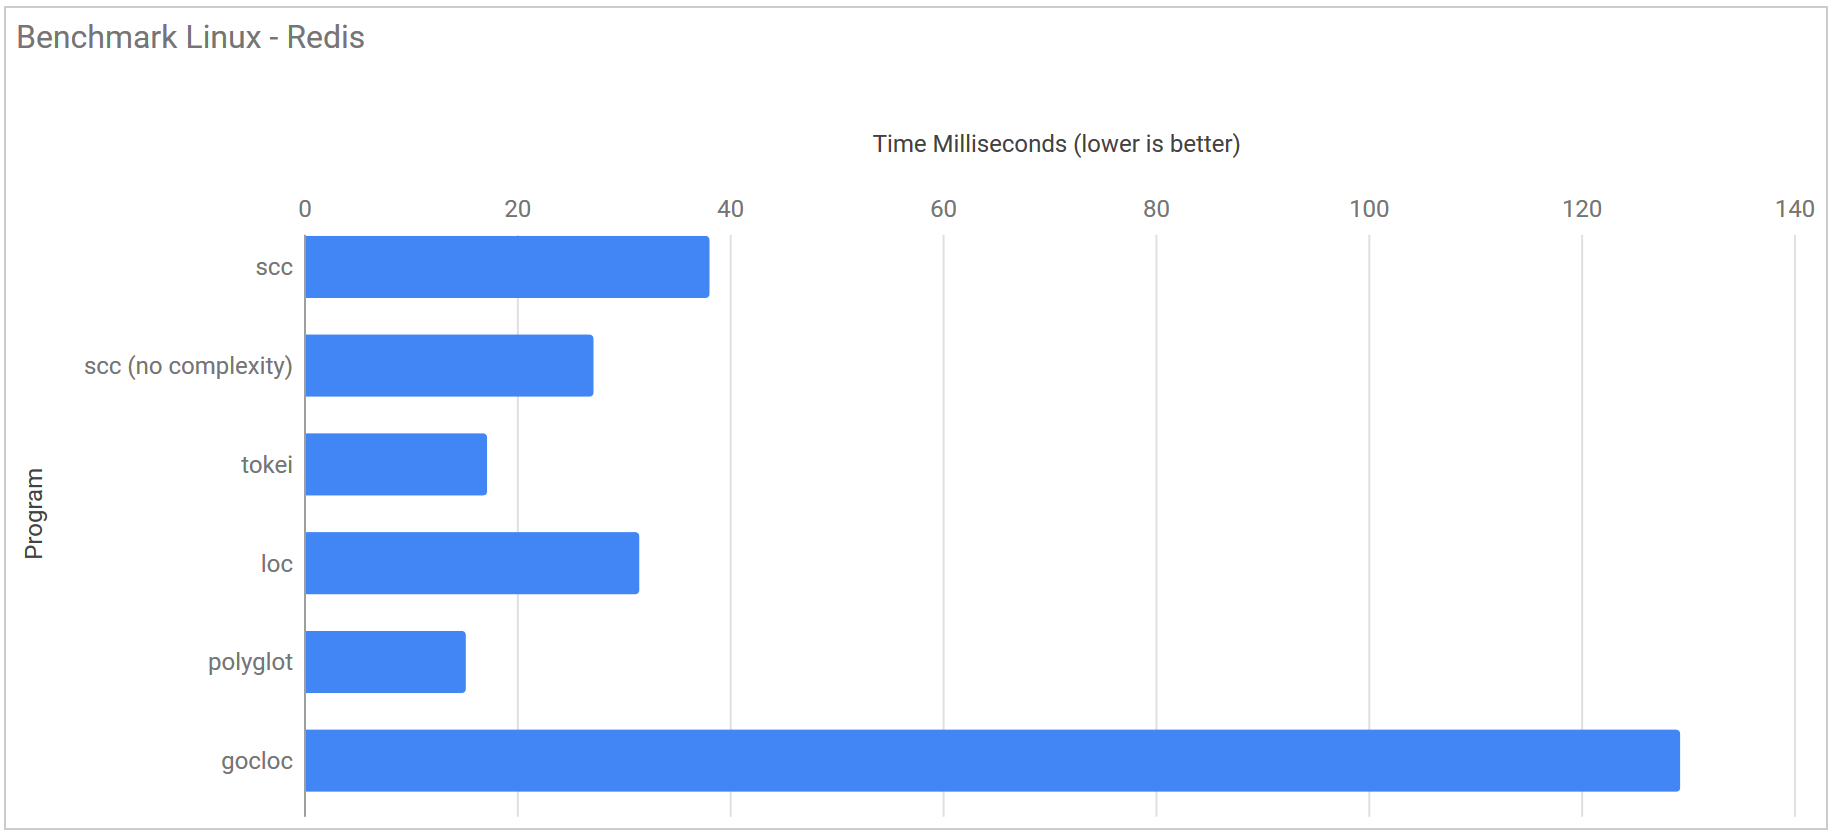
| Program | Runtime |
|---|---|
| scc | 38.1 ms ± 1.2 ms |
| scc (no complexity) | 27.2 ms ± 1.7 ms |
| tokei | 17.2 ms ± 3.0 ms |
| loc | 31.5 ms ± 23.5 ms |
| polyglot | 15.2 ms ± 1.3 ms |
| gocloc | 129.3 ms ± 2.1 ms |
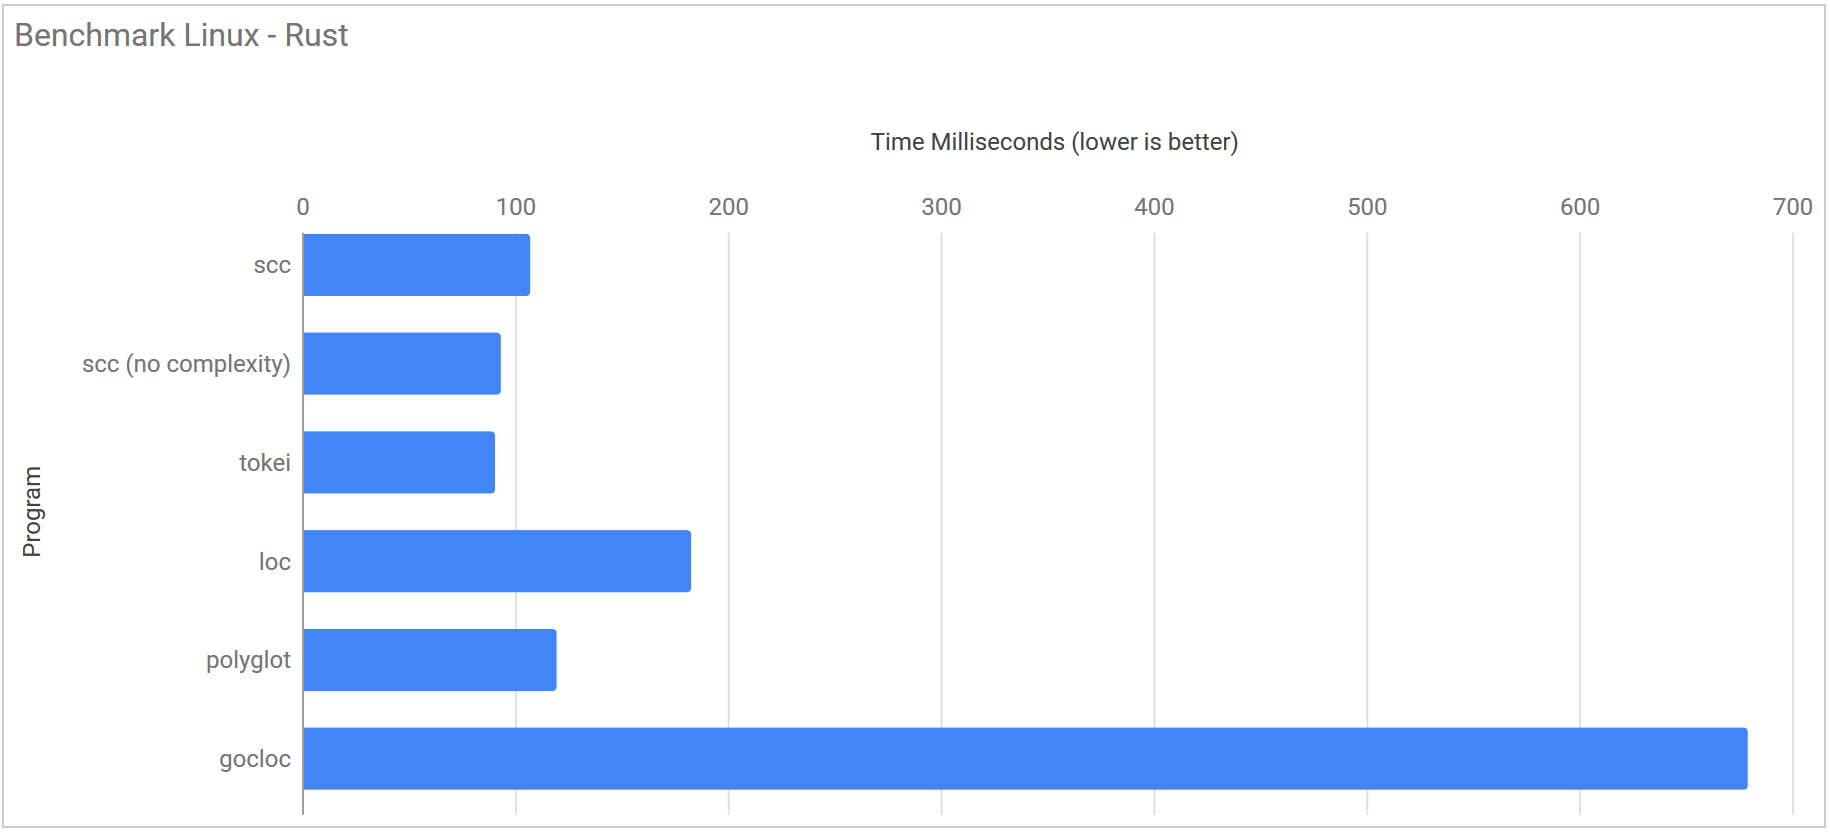
Rust ff6422d7a392acfc8af28994d65af2bbaecea4f6
| Program | Runtime |
|---|---|
| scc | 107.2 ms ± 5.5 ms |
| scc (no complexity) | 93.4 ms ± 2.7 ms |
| tokei | 90.7 ms ± 5.7 ms |
| loc | 182.8 ms ± 55.1 ms |
| polyglot | 119.6 ms ± 3.0 ms |
| gocloc | 679.2 ms ± 5.8 ms |
Linux Kernel 7876320f88802b22d4e2daf7eb027dd14175a0f8
| Program | Runtime |
|---|---|
| scc | 623.5 ms ± 22.1 ms |
| scc (no complexity) | 471.1 ms ± 18.0 ms |
| tokei | 549.7 ms ± 30.8 ms |
| loc | 556.7 ms ± 145.7 ms |
| polyglot | 953.1 ms ± 31.0 ms |
| gocloc | 12.083 s ± 0.030 s |
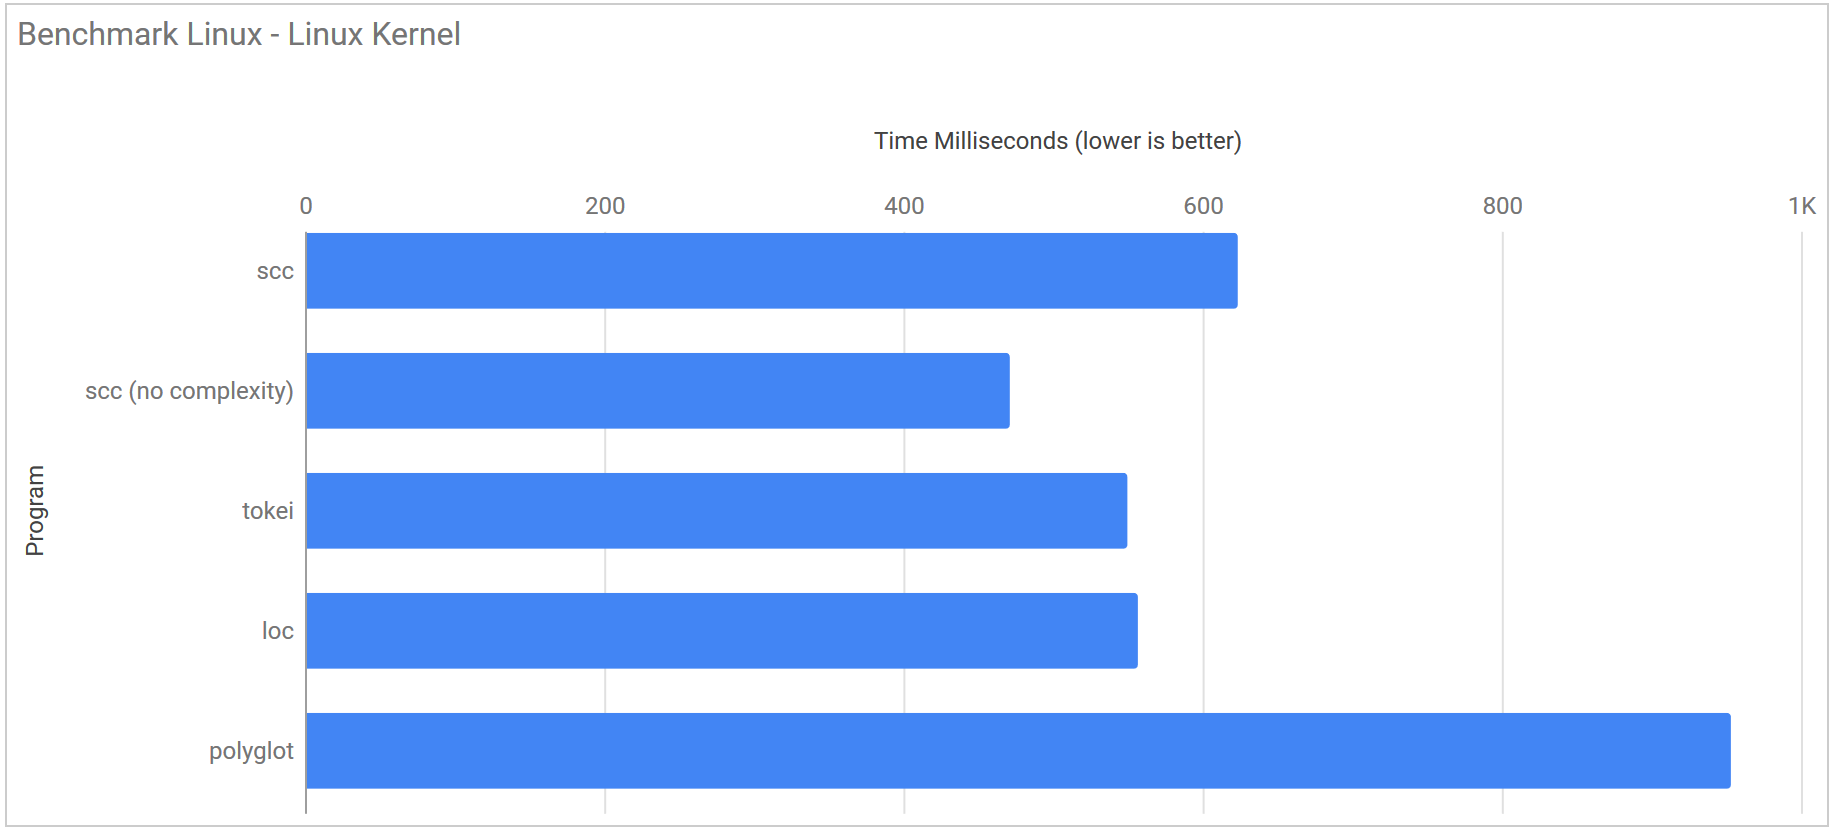
- N.B. gocloc was removed from the graph as its results compressed the other counters so much results were hard to read.
Linuxes 10 copies of the linux kernel
This test consists of 10 copies of the linux kernel in the following directory structure
linuxes
├── linux0
├── linux1
├── linux2
├── linux3
├── linux4
├── linux5
├── linux6
├── linux7
├── linux8
└── linux9
| Program | Runtime |
|---|---|
| scc | 4.760 s ± 0.060 s |
| scc (no complexity) | 3.462 s ± 0.024 s |
| tokei | 5.294 s ± 0.206 s |
| loc | 5.399 s ± 0.399 s |
| polyglot | 8.686 s ± 0.826 s |
| gocloc | 32.930 s ± 0.330 s |
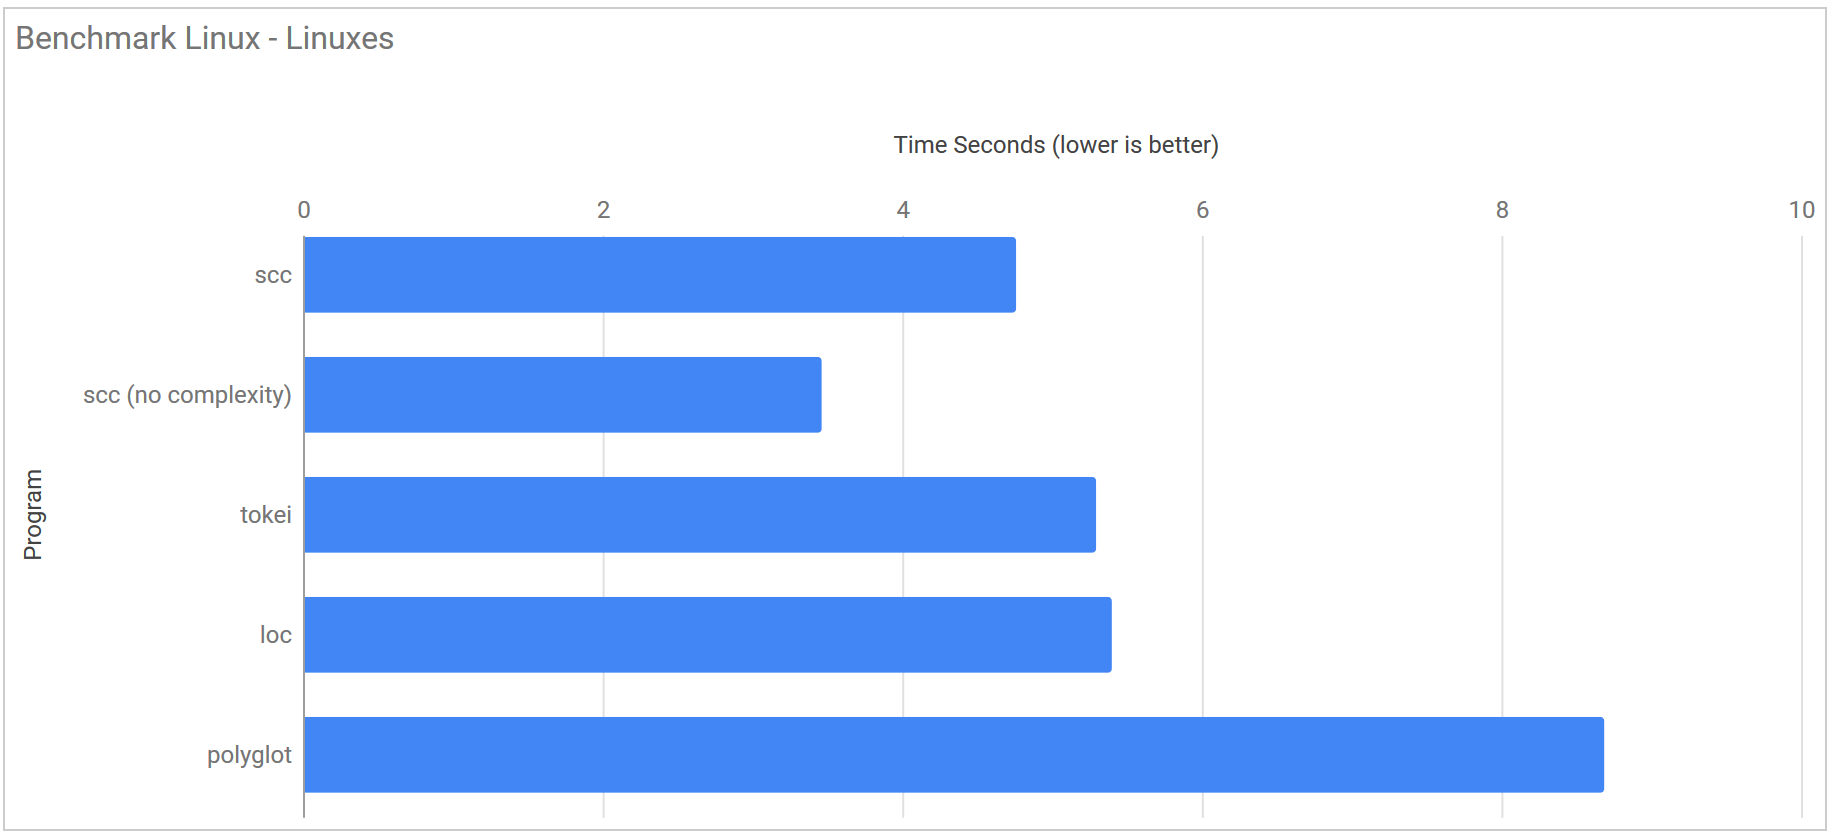
- N.B. gocloc was removed from the graph as its results compressed the other counters so much results were hard to read.
Conclusions
The trade off of building the trie structures when scc starts does slow down the application for smaller repositories such as redis. That said a slowdown of only 10 ms is probably worth it. Keeping in mind on linux that ~15 ms of overhead is usually the process starting, and that most people will not notice the difference between 15 ms and 30 ms for this sort of application, I think its an acceptable trade. Feel free to direct any hate over this decision to https://github.com/boyter/scc/. In short trie’s sell out small repositories somewhat, but I believe it to be a worthwhile gain.
For every possible situation I tested scc is now comparably fast with every other tool even with complexity calculations enabled. Without them it is a similar story but you gain some additional speed. There is some more that can be done in scc itself to improve this still. Modifying how the language features are built would be a good start, but as mentioned this is only applicable on repositories that are small, so its unlikely to modify the benchmarks much.
I honestly do believe that there is not much more performance to be gained from any of these code counting tools from where they are now. They are all getting close to the limits of what the disk and CPU can deliver. Both tokei and loc are pushing very close to this limit along with scc. Regardless I will be revisiting scc from time to time to see if I can get even more performance out of it.
Lastly, all of the optimizations done in scc could be applied to any of the other tools and I would expect them to become faster than scc again, simply because rust in my tests produces slightly more efficient loops. I actually started my own project rcc https://github.com/boyter/rcc/ to port scc over to rust to see what the result would be. When I get some free time again its something I will continue to work on.
I am going to make another claim. That someone is going to copy what is now in scc into tokei, loc, polyglot or perhaps another new tool and get that additional boost, perhaps with a preflight trie which should reduce the startup time.
What I would really like to see though is a standardized JSON file describing all languages. I did think that tokei was perhaps the closest to that goal (hence basing scc on it) but I suspect that since loc and scc have diverged from it there would be a difference of opinion over JSON files being counted for example. Thankfully with all the projects looking at each other more languages will be added and any one of them as a base will be a good place to start.
Probably the saddest thing about this post is that for the most part is how long it is and all about discussing performance. The previous post about fixing the bugs was far shorter and less interesting. I found wiring the previous post somewhat tedious which is not a great sign. Its probably hard to make any post about fixing off by one errors interesting, even though those are the ones that produce the most value usually.
If you made it this far thanks for reading my post, and please do try scc on your local repositories and let me know if you run into any bugs or issues on github.