It started by wanting to write a code counter that would be faster than cloc
Update 2019-03-13
This is now part of a series of blog posts about scc Sloc Cloc and Code which has now been optimised to be the fastest code counter for almost every workload. Read more about it at the following links.
- Sloc Cloc and Code - What happened on the way to faster Cloc 2018-04-16
- Sloc Cloc and Code Revisited - A focus on accuracy 2018-08-28
- Sloc Cloc and Code Revisited - Optimizing an already fast Go application 2018-09-19
- Sloc Cloc and Code a Performance Update 2019-01-09
- Sloc Cloc and Code Badges for Github/Bitbucket/Gitlab
TL/DR
- scc is a very fast accurate code counter with complexity calculations and cocomo estimates written in Go
- scc can be the fastest code counter by a large margin if you disable the garbage collector
- find the source for everything on github https://github.com/boyter/scc/
- surprisingly walking the file tree can be the bottleneck in your application
- memory maps for reading files is useful if the file you are opening is >= 6 MB in size (at least in WSL)
- profiling Go code does not work in the WSL
- the golden rule of performance tuning is to profile/measure, profile/measure and profile/measure again
- the best case vs worst case performance for parallel file tree walking is large
- the default file walker is slow due to calling os.Stat on every node and not running in parallel
- I have probably messed up the COCOMO estimates calculation https://en.wikipedia.org/wiki/COCOMO
- the name comes from joining sloccount, cloc and code complexity in a way that sounds like a Guy Ritchie film
- the whole thing below is written as I went along so its likely some parts are contradictory
- loc is only faster than tokei on single or dual core machines
For those who have never encountered cloc https://github.com/AlDanial/cloc it is what appears to be simple command line tool (it is not simple and has a LOT of functionality!) that iterates through a given directory checking files against a known list of programming languages and then counting the number of code, comment and blank lines. For getting an overview of how large a project is and what languages are being used it is incredibly useful. I remember first using it early in my career to estimate project sizes.
Cloc is written in perl and is probably not known for its performance (I don’t know of anyone who claimed it to be a shining example of a fast application). Running it on a small directory with 6 files on my development machine takes ~1.7 seconds. I gave up running it against a larger code-base like the linux kernel but in my case it took long enough to brew a pot of coffee before I hit CTRL+C.
It got me thinking, what is fast enough? What sort of performance should I aim for? I want it to be faster than cloc, but how much faster?
I would generally argue that performance, like money, isn’t everything unless you have none. Get it working, make it right, make it fast. In that order.
For some user driven tools performance can be everything. Personally when I ask a program to do something I want it done now dammit. Some users may be prepared to wait a while for a result if they perceive value in it such as calculating your tax, you at least want the illusion that a lot is happening to ensure it is correct. Programming tools tend to fall into the I want it now category. You may only run it once every few days, but if its so slow as to produce finger tapping it quickly becomes frustrating, causes the mind to wander and productivity to go down.
It also causes the developer to start thinking that they could make it run faster if they wanted and they start opening a repository and implementing a new version while waiting. Apparently waiting for C++ to compile is why Go became a programming language. Performance is also one of the reasons Google became so popular so quickly.
The other reason Google became popular was accuracy. The flip side to performance is that it usually comes at the expense of accuracy. Usually it is about trade offs. Are you willing to trade speed for accuracy? If you don’t require any accuracy I promise to make the fastest program you have ever seen.
So having established through some flimsy “I am a programmer and my tools are special” hand waving I decided I needed to make the fastest possible code counter. I want it to push the boundaries of the hardware (unlikely) or my own abilities (much more likely). Oh and I don’t want to trade speed for accuracy. I want both.
To make things easier I decided to implement only the basic count that cloc provides and not the fancy SQLite output it provides. CSV and JSON output is about as far as I am going to go. This scope expanded as I progressed however, as is the habit with personal projects.
Beating cloc or its plug-in sloccount (another code counter application which improves performance and provides COCOMO cost estimations) did not seem like such a high bar.
However I am not creative enough to be the only person to have had this idea. A quick search around and I quickly identified two other projects which have the same goals. Great! Now I have additional tools to compare my results against! However a quick check and ALAS! Both are written in Rust and BOTH claim to have excellent performance.
- Tokei (a great name) https://github.com/Aaronepower/tokei in its own words is a program that allows you to count your code, quickly.
- Loc https://github.com/cgag/loc claims to count lines of code quickly. It also claims to be 100x faster than cloc and ~2-10x faster than tokei, depending on how many files are being counted.
Also as I progressed with coding I discovered there was another implementation.
- Gocloc https://github.com/hhatto/gocloc which claims to be inspired by Tokei.
This might be a problem.
I have experimented with Rust before and I was blown away with the performance you can wring out of it. So should I implement yet ANOTHER code counter in Rust? I decided against that. I do like a challenge though http://www.boyter.org/2017/03/golang-solution-faster-equivalent-java-solution/ and I was looking to expand my knowledge of Go and learn how to write multi CPU aware code in it. So I chose Go. At the time I did not know that Gocloc already existed so I thought I was being original in the choice of language.
One very nice thing about Tokei however is that is has a nice database of language names with comment, quotes and file extensions. It seems both loc and gocloc have used this list as a reference. As such I took a copy and augmented it using some of the types I had gathered for https://searchcode.com/ and https://searchcodeserver.com/
I started thinking about what sort of projects should I optimize for? After all at some point we may need to make a trade off in performance in calculating for larger vs smaller repositories. However after some more pondering I discarded this idea. I said I wanted absolute performance. This means I wanted it to work quickly on small and large projects. If I can optimize for one it should be possible to optimize for both.
Given that tokei, loc and gocloc exist it means I also want to beat them when it comes to processing. Its good to have lofty goals.
Regarding performance, specifically CPU performance. Back on the old days of single cores and real programmers http://www.cs.utah.edu/~elb/folklore/mel.html https://en.wikipedia.org/wiki/The_Story_of_Mel there was only one way to make code faster. Have it do less http://asserttrue.blogspot.com.au/2009/03/how-to-write-fast-code.html The less it did the faster the program finished based on wall clock time. To quote one of the maintainers of grep “The key to making programs fast is to make them do practically nothing” https://lists.freebsd.org/pipermail/freebsd-current/2010-August/019310.html
Those days and the “free performance lunch” ended a while ago and now the answer is a bit more complex.
Now-day’s you want your program to do as little as possible, on many cores, while making it easier for the cores to do the next thing. This means you need to run the program in parallel, while being friendly to the CPU caches and the branch predictor. Thankfully compilers and CPU designers understand that these things are hard for all but the most brilliant of developers (I am not in this category). As such you probably don’t worry too much about anything except how to run things in parallel. That said if you run into one an issue that can be solved by changing a branching instruction to help the predictor (I have done this exactly one time) you will feel like a programming god for a while.
Some things to keep in mind when if you plan to continue reading
- where command line output is included below I have often cut out empty lines to reduce the size
- my development machine is a Surface Book 2 using Ubuntu WSL
- many of the benchmarks/results before the benchmarks section are run on a variety of machines and sizes
- the times for the results can be either in milliseconds or seconds
Architecture
Since this was my second attempt at a Go project I was able to use the benefits of hindsight to avoid making similar mistakes. The first one I made was dealing with lists. Coming from a C#/Java/Python background where the way to make code run in parallel is to build a list and then use parallel streams, parallel linq or multiprocessing to iterate over that list using all available CPU’s. However in Go what you really want to do is build streams.
The other thing you need to do is let your prejudices go and embrace go-routines. The idea of spinning up thousands of threads in something like Java is going to land you in a world of pain. However the same cannot be said of Go. Not going to dive into this too much but suffice to say so long as you limit the CPU bound GoRoutines to the number of CPU’s you can get away with many thousands performing other tasks.
Given the above this is the design I came up with, based on the idea that you use streams similar to unix pipes.
Walk Process -> File Reader -> File Processor -> Summeriser
With each process handing work from one to the other using a buffered channel set to the number of CPU cores.
I did at one point put channels as buffers between each of the work processes however as the application turned out to be CPU bound this was pointless. The reason for this is that by setting the size of each buffer I can control the parallelism of the code. Getting back to making things fast I only want there to be as many file processors as there are CPU’s. We want to avoid CPU context switches there if at all possible. By having buffers between I can control the the number of workers without blocking any other task. Just because the File Reader or File Processor is slow there is no reason to block the Walk Process.
It turned out that just making it as simple as possible worked equally as well for everything I tried, so I removed the intermediate buffers.
I then started building out the calculation process. For the first attempt I wrote a simple state machine that produced reasonable outputs for the samples I had. Happy with the initial results I started to look at performance.
The Quest for Disk Performance
One thing I noticed early on is that directory walking using the native Go file walker is slow. How slow you ask? See http://www.boyter.org/2018/03/quick-comparison-go-file-walk-implementations/ where I posted some quick stats on it. As such I swapped out for the fastest implementation I could find which was godirwalk.
In order to establish how fast these disk operations should be able to run I also tested using ripgrep.
Ripgrep if given the right search term should scan every byte of every file. It gives an excellent idea of just how quickly you can pull a directory full of files into memory and inspect every byte. I suspect its getting as close to as much performance you can get out of the machine as you can. Will I be able to beat ripgrep’s performance for these cases? Realistically probably not, as and I am going to be working in a slightly higher level language.
Remember that any comparisons to ripgrep is very much comparing apples to oranges. It does not white-list files and is generally doing more work per file than anything I am building. It also solves a totally different problem.
I installed all the applications I was testing against, uploaded the latest version of scc, cloned a copy of the linux kernel and started some basic benchmarking using hyperfine which calculates the runtime over 10 runs.
| Program | Runtime |
|---|---|
| ripgrep | 332.4 ms ± 19.5 ms |
| scc (early version) | 1.650 s ± 0.133 s |
| tokei | 1.828 s ± 0.148 s |
| loc | 3.773 s ± 0.494 s |
Not a bad place to start. Compared to tokei scc is slightly slightly faster and loc despite its claims is much slower. Ripgrep however leaves everything for dead.
The question I started asking at this point, is why is ripgrep so much faster? On average with a warm cache it runs 4-5x faster than anything else.
Just to see if this problem scaled linearly I make 14 copies of the linux kernel and dumped them all in a single directory. I then ran the same benchmark over that.
| Program | Runtime |
|---|---|
| ripgrep | 3.999 s ± 0.095 s |
| scc (early version) | 12.552 s ± 4.321 s |
| tokei | 21.274 s ± 0.450 s |
| loc | 51.652 s ± 10.148 s |
Yep looks like the times scale linearly. Its nice to see that this test still make scc still look good as it is still the fastest code counter here.
So back to the question, why is scc slower than ripgrep? I had a feeling that at this point the issue is not the processing, but the pulling of the files from disk into memory. To verify I build a version of scc with no hot loop. No checking of the bytes. Rather than do anything in the countStats method which is the hot loop I had it just return.
func countStats(fileJob *FileJob) {
  return
Of course this is a useless program with no useful output but it should establish if the bottle neck is in the CPU.
| Program | Runtime |
|---|---|
| ripgrep | 338.1 ms ± 7.2 ms |
| scc (early version) | 1.080 s ± 0.059 s |
While the hot loop does add some overhead when enabled (it is iterating through all the bytes) it looks like the issue is with the reading of the files into memory. If disk were not an issue I would expect this loop to run in a similar time otherwise. So whats the difference?
Thankfully the author of Ripgrep provided an excellent discussion and analysis of how ripgrep works https://blog.burntsushi.net/ripgrep/ Reading this carefully over this gives a reasonable idea on how ripgrep works without having to actually read its source code (which I am not smart enough to understand).
One of the interesting findings is that ripgrep sometimes uses memory maps, specifically for large files. By contrast scc was written to be as simple as possible and just loads the file into memory. It seems like memory maps are worth considering, that file access in Go is slower than Rust, or more likely that I am doing something wrong.
Pause here.
It’s at this point I made a classic newbie mistake with performance. I didn’t measure. I made an assumption and spent of lot of time digging a dry hole. This despite being a developer for over 10 years and telling everyone else “Always profile and measure. What you think will be slow probably won’t be.”.
I did debate rewriting this post to clean the history and make myself look smarter but decided against it. There are some useful tidbits in the below, and I wanted this post to be about what I actually did, warts and all.
Time to experiment with memory maps and file reading in Go.
Memory maps are something I started and finished knowing very little about. Wikipedia has a pretty good overview https://en.wikipedia.org/wiki/Memory-mapped_file but as far as I can tell in principle using them avoids the overhead of a sys-call and you can use the kernels memory space to read files avoiding the memory copy. In short it can be much faster at the expense of potentially wasting some memory due to the way it organizes bytes.
It was also around this time I started tweeting my results.
Comparisons to ripgrep brought out some discussion with Andrew Gallant probably better known as BurntSushi and the author of ripgrep. He was mostly interested in the lackluster speed I was getting from ripgrep. This was pretty quickly established to be due to me using WSL on Windows which is known to have disk performance issues. If you read the ripgrep announcement you can see he comprehensively proves that mmaps are not as fast as you would believe. This also came out in our brief twitter conversation. Not that I don’t believe him but I would like some independent confirmation, and I wanted to find out at what point are memory maps worth using.
The first question I had was what is the average file size for the Linux Kernel. With this we can test on a file of a similar length and know if reading such a file using memory maps is faster.
$ find . -name "*.c" | xargs ls -l | gawk '{sum += $5; n++;} END {print sum/n;}'
18554.8
The above should find all the C files in a directory and then average their length in bytes. I think. My bash-fu is lacking.
Given the above lets try a benchmark on a file of that length.
$ dd if=/dev/urandom of=linuxaverage bs=18554 count=1
18554 bytes (19 kB, 18 KiB) copied, 0.003102 s, 6.0 MB/s
The above is used to make the file using random bytes from urandom which should avoid any disk tweaks to speed things up. Then using an implementation that opens the file using IoUtil and another using memory maps.
$ go test -bench .
pkg: github.com/boyter/scc/examples/mmap
BenchmarkIoUtilOpen-8              20000            111981 ns/op
BenchmarkMmapUtilOpen-8              500           2614086 ns/op
Not brilliant. Memory maps appear to be ~26x slower. So what size file does make a difference then? A bit of experimentation and I managed to get the results to converge at about 6 MB on my development machine which is a Surface Book 2 running in the WSL.
$ dd if=/dev/urandom of=linuxaverage bs=6000000 count=1 && go test -bench .
6000000 bytes (6.0 MB, 5.7 MiB) copied, 0.013786 s, 435 MB/s
pkg: github.com/boyter/scc/examples/mmap
BenchmarkIoUtilOpen-8                500           2661080 ns/op
BenchmarkMmapUtilOpen-8              500           2530480 ns/op
Considering the average size of a file we are searching is under 20 KB there is no point in using memory maps based on the above.
However scc is still slower than ripgrep and the above does not explain it. Maybe its something to do with the way I am reading the file? In the above I just read the whole file at once. Perhaps mmap wants me to read chunks, process and then finish at the end. The other issue could be that because the access isn’t random across the disk. Checking the latter is easier so I tried that.
I modified the test so that it walks loops over a copy of redis calculating as we go.
$ go test -bench .
pkg: github.com/boyter/scc/examples/mmap
BenchmarkIoUtilOpen-8                 10         138882400 ns/op
BenchmarkMmapUtilOpen-8               10         140421700 ns/op
Interesting. It actually gets to be almost the same performance when doing it this way. The redis source isn’t exactly huge, so I tried the same test out against the benchmark of the linux kernel.
$ go test -bench .
pkg: github.com/boyter/scc/examples/mmap
BenchmarkIoUtilOpen-8                  1        15183734000 ns/op
BenchmarkMmapUtilOpen-8                1        15455014000 ns/op
Pretty much a dead heat. So it seems that using mmaps in the real world has no performance gains unless you hit a large file. I was getting suspicious at this point that my development machine using WSL was influencing the results. I created a virtual machine on Digital Ocean running Ubuntu to see how that fared. The results turned out to be very similar.
All I have managed to do was establish that mmaps are not the answer to my current performance woes.
This still begs the question, what is causing scc to be so much slower than ripgrep?
I decided to try ripgrep on a file thats just large enough to be at the meeting point between the mmap and non-mmap performance size to avoid any gains from using one file read over another. I also thought I would limit the number of threads ripgrep could use as I had a feeling it might be using parallel reads to speed things up.
| Program | Runtime |
|---|---|
| ripgrep -j1 | 89.5 ms ± 6.4 ms |
| ripgrep | 55.9 ms ± 6.2 ms |
| scc (early version) | 82.4 ms ± 5.3 ms |
Ah ha! Looks like ripgrep spawns mutliple threads to read a file. In this case at least two as it is almost twice as fast. So if the code base has many larger files this is likely to be faster (or if its a single file) but slower for small ones unless it calculates the size in advance. Lets find out.
Trying against a fresh checkout of redis which with ~700 files has far fewer files in it than the linux kernal.
| Program | Runtime |
|---|---|
| ripgrep | 82.9 ms ± 8.6 ms |
| scc (early version) | 65.6 ms ± 2.2 ms |
So for smaller repositories we are processing about as fast as ripgrep. For larger ones though it is leaving us sucking dust.
Again this still begs the question. Why is scc so much slower?
One excellent thing about Go is that you can view view the source of Go itself and than since its written in Go you can probably understand a lot of it and hence look at how things are implemented. The thing that appears to be causing us the most grief is this line.
content, err := ioutil.ReadFile(res.Location)So looking under the hood of ioutil.ReadFile shows that it allocates by default a buffer size of 512 KB to store the file. It then expands this out to the actual size. Sounds reasonable, but is it the most efficient way to read the file from the disk? What if we set the buffer to a much larger size and use bufio ourselves?
Some code to do that.
func bufferedReadFile(fileLocation string, buffersize int) []byte {

  file, err := os.Open(fileLocation)
  if err != nil {
    fmt.Println(err)
    return nil
  }
  defer file.Close()

  output := []byte{}
  buffer := make([]byte, buffersize)

  for {
    bytesread, err := file.Read(buffer)

    if err != nil {
      if err != io.EOF {
        fmt.Println(err)
      }

      break
    }

    output = append(output, buffer[:bytesread]...)
  }

  return output
}
and the results,
BenchmarkIoUtilRead10k-8                           10000            105909 ns/op
BenchmarkBuffIoRead10k32768-8                      10000            104491 ns/op
BenchmarkIoUtilRead100k-8                          10000            134854 ns/op
BenchmarkBuffIoRead100k32768-8                     10000            177795 ns/op
BenchmarkIoUtilRead1000k-8                          3000            434045 ns/op
BenchmarkBuffIoRead1000k32768-8                     1000           1445289 ns/op
BenchmarkIoUtilReadLinuxAverage-8                  10000            107169 ns/op
BenchmarkBuffIoReadLinuxAverage32768-8             10000            109831 ns/op
BenchmarkIoUtilReadText-8                          10000            114302 ns/op
BenchmarkBuffIoReadText32768-8                     10000            113819 ns/op
The implementation at least as I have implemented it makes no difference with different buffer sizes or is worse most of the time.
At this point I started looking at running parallel reads of the same file. However this seemed insane as its probably faster to read continuous bytes for small files.
So all I managed to establish in the above was that the way I used memory maps makes no difference for small files and that I cannot write better code than the Go maintainers (not a big surprise there). I did so pretty comprehensively though so I have that going for me.
Assuming that the reading from disk is about as efficient as it can be for the moment lets look at what else it could be. It was around here I started looking at profilers (which I should have done from the start) and adding more verbose output. One of the things I did was add a simple millisecond timer to determine how long it took to walk the file tree.
$ time scc linux
DEBUG 2018-03-27T21:34:26Z: milliseconds to walk directory: 7593
--SNIP--
scc linux  11.02s user 19.92s system 669% cpu 7.623 total
Oh… so that would be why it is slow. Notice that the time to walk matches the time to run almost exactly.
It would appear that the bottleneck is actually walking the file system and not the actual processing of the files, nor reading those files into memory. In other words the application is not currently CPU bound its bottlenecked by how quickly it can walk the file tree. So much for looking into memory maps or fiddling with buffer sizes. What a fool I have been!
If we can make the walk process faster we should be able to improve the above results.
If you remember back at the start one of then first things I did was investigate ways to speed up walking the file tree. Two of the candidates I looked at were implementations of parallel tree walkers. In the end it turned out that gogodirwalk was the fastest implementation even without running in parallel. Naturally my evil plan to make it run even faster, was to make it run in parallel.
I modified the code to inspect the initial directory passed in and spawn a go-routine for child directory to walk that child. Then the remaining files were pumped into the processing pipeline channel.
This approach has the problem that it makes performance unpredictable between different directories. If there are many directories we spawn more go-routines and if there is only one folder we only spawn one. The best vs worst case performance profiles of this are wildly different, which is probably why the official Go implementation does not do this.
So with the above simple process in place.
$ time scc linux
DEBUG 2018-03-27T21:48:56Z: milliseconds to walk directory: 3648
--SNIP--
scc linux  9.36s user 17.06s system 711% cpu 3.715 total
Excellent. The last time to process was ~7 seconds. It appears that we have resolved the disk bottlenecks by a considerable amount.
The Quest for Accuracy
The obvious and wrong way (IMHO) to count lines and code inside a file is to use strings and regular expressions. For example cloc in its limitations section mentions that this is how it operates and as such cannot count some things correctly https://github.com/AlDanial/cloc#Limitations
I have included the relevant portion below.
printf(" /*");
for (i = 0; i < 100; i++) {
    a += i;
}
printf("*/ ");
look to cloc like this
printf(" xxxxxxx
xxxxxxx
xxxxxxx
xxxxxxx
xxxxxxx     ");
Cloc counts it as 1 line of code and 4 of comments. However it should be counted as 5 lines of code. Of the sample programs I am comparing against, tokei, loc, gocloc, cloc and sloccount, only tokei and sloccount get the counts correct.
$ cloc samplefile
-------------------------------------------------------------------------------
Language                     files          blank        comment           code
-------------------------------------------------------------------------------
Java                             1              0              4              1
-------------------------------------------------------------------------------

$ tokei samplefile
-------------------------------------------------------------------------------
Language            Files        Lines         Code     Comments       Blanks
-------------------------------------------------------------------------------
Java                    1            5            5            0            0
-------------------------------------------------------------------------------
Total                   1            5            5            0            0
-------------------------------------------------------------------------------

$ loc samplefile
--------------------------------------------------------------------------------
Language             Files        Lines        Blank      Comment         Code
--------------------------------------------------------------------------------
Java                     1            5            0            3            2
--------------------------------------------------------------------------------
Total                    1            5            0            3            2
--------------------------------------------------------------------------------

$ gocloc samplefile
-------------------------------------------------------------------------------
Language                     files          blank        comment           code
-------------------------------------------------------------------------------
Java                             1              0              5              0
-------------------------------------------------------------------------------
TOTAL                            1              0              5              0
-------------------------------------------------------------------------------

$ sloccount samplefile

SLOC    Directory       SLOC-by-Language (Sorted)
5       samplefile      java=5
Not only does cloc get the counts wrong doing this by regular expression it is a far slower way to process a file.
So I decided that if I was not using regular expressions I would scan byte by byte. That is look through every byte of every file and using a very simple state machine determine if a line is empty, a comment, code or a string containing one of the others. Turns out this is how tokei works as well https://github.com/Aaronepower/tokei/issues/175
Another option would be to build an AST which would probably be much slower than byte counting and possibly slower than the regular expression parser.
Why look at every byte? This is pretty easy to answer actually. Because it has to. We need to know where strings start and end, where comments begin etc… Since a comment can be a single byte we need to check every byte to know where they are. It is unlikely to be the slowest part of the application. It’s more likely that reading from disk is going to slow things down than the CPU. Note that ripgrep uses a far fancier technique https://blog.burntsushi.net/ripgrep/#linux-literal-default as written by BurntSushi
Counting lines can be quite expensive. A naive solution—a loop over every byte and comparing it to a \n—will
be quite slow for example. Universal Code Grep counts lines using SIMD and ripgrep counts lines using
packed comparisons (16 bytes at a time). However, in the Linux code search benchmarks, because the size of
each individual file is very small and the number of matches is tiny compared to the corpus size, the time
spent counting lines tends to not be so significant. Especially since every tool in this benchmark parallelizes
search to some degree. When we get to the single-file benchmarks, this variable will become much more pertinent.
Note that scc falls very much into the category of counting lots of small files. My benchmarks show that as BurntSushi claims it is not a significant portion of the runtime. Also because scc does not need to check line boundaries there is no need to worry about newlines beyond resetting the current state we are in. So while it may be “slow” its not a factor at all in the way the application performs.
Operating on single bytes also makes it much easier to move in the state engine. However it does mean you have to check each byte potentially multiple times. While it should be faster than the reading of files from the disk it is something to keep in the back of your mind that its very possible to become CPU bound if not careful.
However while it sounds simple its not quite as easy as it would appear. Take the following examples.
i++; /*
comment
*/
How many lines of code is the above? I would personally say 1 with 2 lines of comments. How about,
i++; /*
comment
*/ j++;
I would say 2 lines of code with 1 line of comment. However it can get more complex than that. Take for example,
string.Format(" /*comment " +
  " something " +
  "*/ ");
How many lines of code is the above? I would say 3. How about with multiple line strings
fmt.Println(`
  /* I am followed by empty line // Woah!

  something! */
`) /* something */
All of the above is code but easily fools many parsers that rely on regular expressions.
So looking at the above we need to code a simple state machine that works for the above. It looks something like the below.
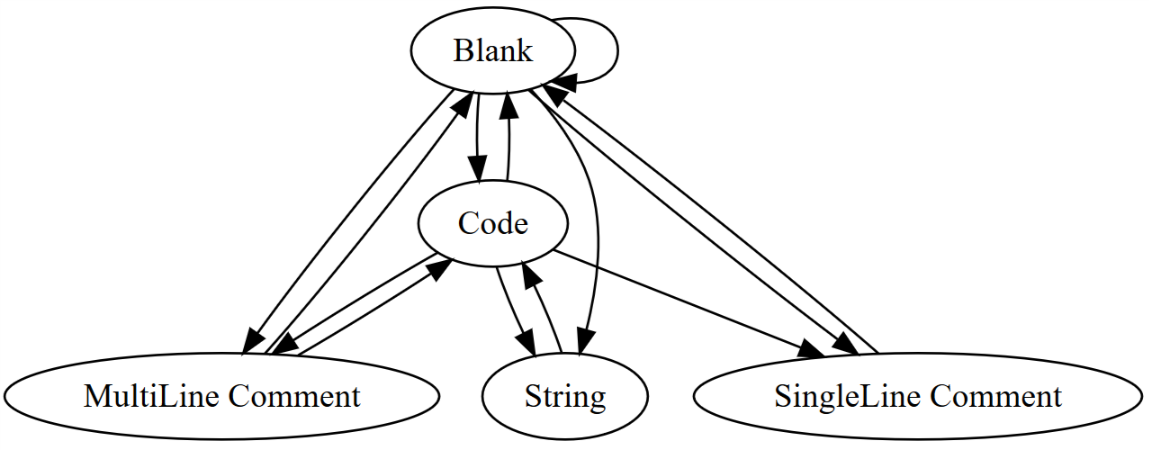
Thankfully the sort of cases I mention above are rare. Given enough creative evil you can probably fool any of the code counters I am comparing against, or rather any that do not build an AST. This includes Tokei which appears to be the most accurate. I decided early on that while I wanted accuracy I want it for 99.999% of cases. Someone trying to confuse the counter is not a case I am going to spend a great deal of time working on.
Trying Things Out
With the above implemented producing accurate results coupled with the work I put into disk performance I thought I would try out a quick benchmark on the most powerful Digital Ocean machine I can spin up which happens to be a 32 core monster.
I tried things out on 10 copies of the linux kernel dumped into a single directory.
| Program | Runtime |
|---|---|
| ripgrep | 4.815 s ± 0.206 s |
| scc (unoptimised) | 3.629 s ± 0.262 s |
| tokei | 6.543 s ± 0.075 s |
In this case it seems scc picked a more optimal number of parallel threads to walk the file tree. There is no other reason for tokei or ripgrep to be slower in this case based on the previous result.
That being the case I wanted to find out in what situations for disk layouts they work well and for which they do not. There are a few situations at test here.
The first I considered was a very deep directory with a few files in each sub directory. This is not friendly to parallel algorithms. Each next step requires the previous steps operation to finish and as such there isn’t much you can do to offload the work. Another case of this would be a single directory with hundreds to thousands of files of files in it. Again you need to look into the directory to get the files, and there is no way to run that in parallel.
So there is little point optimizing for either of the above cases. What is the optimal case. That would be a directory with subdirectories that looks like a balanced tree. The trick would be having the root having as many sub-folders as is optimal to spawn threads for, which of course depends on how fast your disk is and how many CPU’s you have.
I decided to write a simple python script which would generate some directories to try out the above and see how each tool performs. The tool with the very imaginative name “create_folders_with_files.py” creates a series of directories designed to test the best/worst case situation for each of the tools. Example output of what it creates using tree is included below.
- Case 0 Create a directory thats quite deep and put a 10000 files at the end
- Case 1 Create a directory thats quite deep and put 100 files in each folder
- Case 2 Create a directory that has a single level and put 10000 files in it
- Case 3 Create a directory that has a two levels with 10000 directories in the second with a single file in each
- Case 4 Create a directory that with 10 subdirectories and 1000 files in each
- Case 5 Create a directory that with 20 subdirectories and 500 files in each
- Case 6 Create a directory that with 5 subdirectories and 2000 files in each
- Case 7 Create a directory that with 100 subdirectories and 100 files in each
With those created I did some benchmarks using scc, ripgrep and tokei.
| Program | Test Case | Runtime |
|---|---|---|
| scc | 0 | 603.4 ms ± 20.1 ms |
| ripgrep | 0 | 591.0 ms ± 26.7 ms |
| tokei | 0 | 802.6 ms ± 31.2 ms |
| scc | 1 | 122.4 ms ± 5.9 ms |
| ripgrep | 1 | 150.7 ms ± 10.8 ms |
| tokei | 1 | 176.1 ms ± 13.1 ms |
| scc | 2 | 597.5 ms ± 21.6 ms |
| ripgrep | 2 | 471.0 ms ± 27.0 ms |
| tokei | 2 | 546.9 ms ± 24.8 ms |
| scc | 3 | 1.478 s ± 0.125 s |
| ripgrep | 3 | 1.141 s ± 0.022 s |
| tokei | 3 | 1.921 s ± 0.229 s |
| scc | 4 | 627.6 ms ± 131.1 ms |
| ripgrep | 4 | 647.3 ms ± 52.9 ms |
| tokei | 4 | 742.8 ms ± 59.1 ms |
| scc | 5 | 503.2 ms ± 30.0 ms |
| ripgrep | 5 | 523.7 ms ± 50.8 ms |
| tokei | 5 | 599.9 ms ± 32.8 ms |
| scc | 6 | 470.9 ms ± 25.0 ms |
| ripgrep | 6 | 457.6 ms ± 21.2 ms |
| tokei | 6 | 525.0 ms ± 18.8 ms |
| scc | 7 | 679.0 ms ± 48.1 ms |
| ripgrep | 7 | 635.4 ms ± 44.0 ms |
| tokei | 7 | 734.1 ms ± 42.7 ms |
What was interesting is that the tests for #4 and #5 actually got slower each time the benchmark was run for all tools. I have nothing to explain this other then that the layout was not friendly to whatever tricks the OS uses to speed up disk access, and that somehow its usage pattern caused a lot of cache misses.
What bothered me was that for the deep directory case #1 ripgrep was still on average slightly faster. Considering how paired down the walker I was using was I had a feeling that this was down to the garbage collector kicking in. So I tried again with it disabled.
| Program | Runtime |
|---|---|
| ripgrep | 549.5 ms ± 26.8 ms |
| scc (no gc) | 510.7 ms ± 17.1 ms |
Disabling GC for the walk claws back ~90 ms from the previous run and now the walk is faster than the one in riprep. In fact trying things out this improves performance considerably for all processing.
I then tried it out on a small virtual machine and managed to get an out of memory error. Turning off the GC by default would not be a good idea. Yes it improves performance, but it forces the user to know if they have enough RAM and potentially turn it back on. Since you can turn off the GC via an environment variable its probably best to leave this to the user to decide.
So if you want things to run as fast as possible using scc and you have lots of RAM you can set the environment variable GOGC to -1 for a nice speed boost https://golang.org/pkg/runtime/debug/#SetGCPercent
There was one thing nagging me. What happens if someone runs scc on a older style spinning rust hard disk. They are probably not very friendly to having random access all over the disk. It also caused me a first world issue in that I realized I don’t have a spinning rust disk on any of the machines I use. Talk about progress. I had to dig up a very old net-book using an Atom processor in order to try things out.
Turns out there was no appreciable difference as far as I can tell. I used the Django project as a test bed (which took ~20 seconds to process) and with or without a setting to reduce the number of processes it ran in roughly the same amount of time. This included runs where I dropped the disk file caches as well. Very cool.
The last thing I wanted was to add the ability to filter out duplicate files. To do so I needed to build a hash of the file contents and then check if anything matches. I had a look into adding murmur3 hash which is one of the faster hashing methods, but decided against it and used MD5. The main reason being that its in the standard library. It is slower than murmur3 but not by enough to bring in another dependency.
Another thing that factored into the decision was which hash algorithm allowed streaming bytes. Because the core loop of the application loops bytes we can feed that byte into the hash directly and get the result at the end rather than passing all the bytes and save another loop. Checking for duplicates slows the count down by about 20% for most of the tests I tried.
Optimisations
At this point I started to run though all of the edge case calculations for code counters. Dealing with multi-line strings and the like. This took a while to work out but after a few days I had what appeared to be accurate results.
So with the application producing decent output and being fast I decided I wanted to add some crude complexity calculations to the output. After all yet another code counter is not that useful. Having one that could point out potentially problematic files would allow it to stand apart. Since I did that it blew away most of the performance I put in.
A quick check on 1, 2, 4, 16 and 32 core machines showed that all of a sudden scc went from faster than tokei and loc to slower by about 2x. That is for every second tokei took to count code scc took two.
The reason is that, firstly I was paying the price for accuracy and secondly that for any byte I was looking at while in the code state meant there were an additional ~8 byte checks to determine if there any code that would require an increase to the complexity count. This ended up producing a large chain of if statements and some additional loops that ate all of the performance I had originally put into the application. Suddenly I was very CPU bound and gaining that performance back was going to be a big ask.
I resorted to salami tactics, that is slice by slice whittle down every possible wasted CPU cycle.
Time to start profiling.
The Go profiling tools are pretty easy to use. I found the easiest way to enable them was to import runtime/pprof and then just after the main function add lines to set it up.
import "runtime/pprof"

func main() {
 f, _ := os.Create("profile.pprof")
 pprof.StartCPUProfile(f)
 defer pprof.StopCPUProfile()
You then just compile and run, and it will produce a profile.pprof file you can then analyze.
One issue I did run into was running the above using the WSL for Windows. No matter what I did when run in the WSL I would never get any profile output. The solution was the compile on Windows run the application to capture the output and then for the web view use WSL for that and for inspection use Windows.
So to get the nice web output (inside WSL)
go tool pprof -http=localhost:8090 profile.pprof
and to inspect the lines themselves using cmd
go tool pprof profile.pprof
and to get the line by line counts when inside the profiler in cmd
list github.com/boyter/scc/processor.countStats
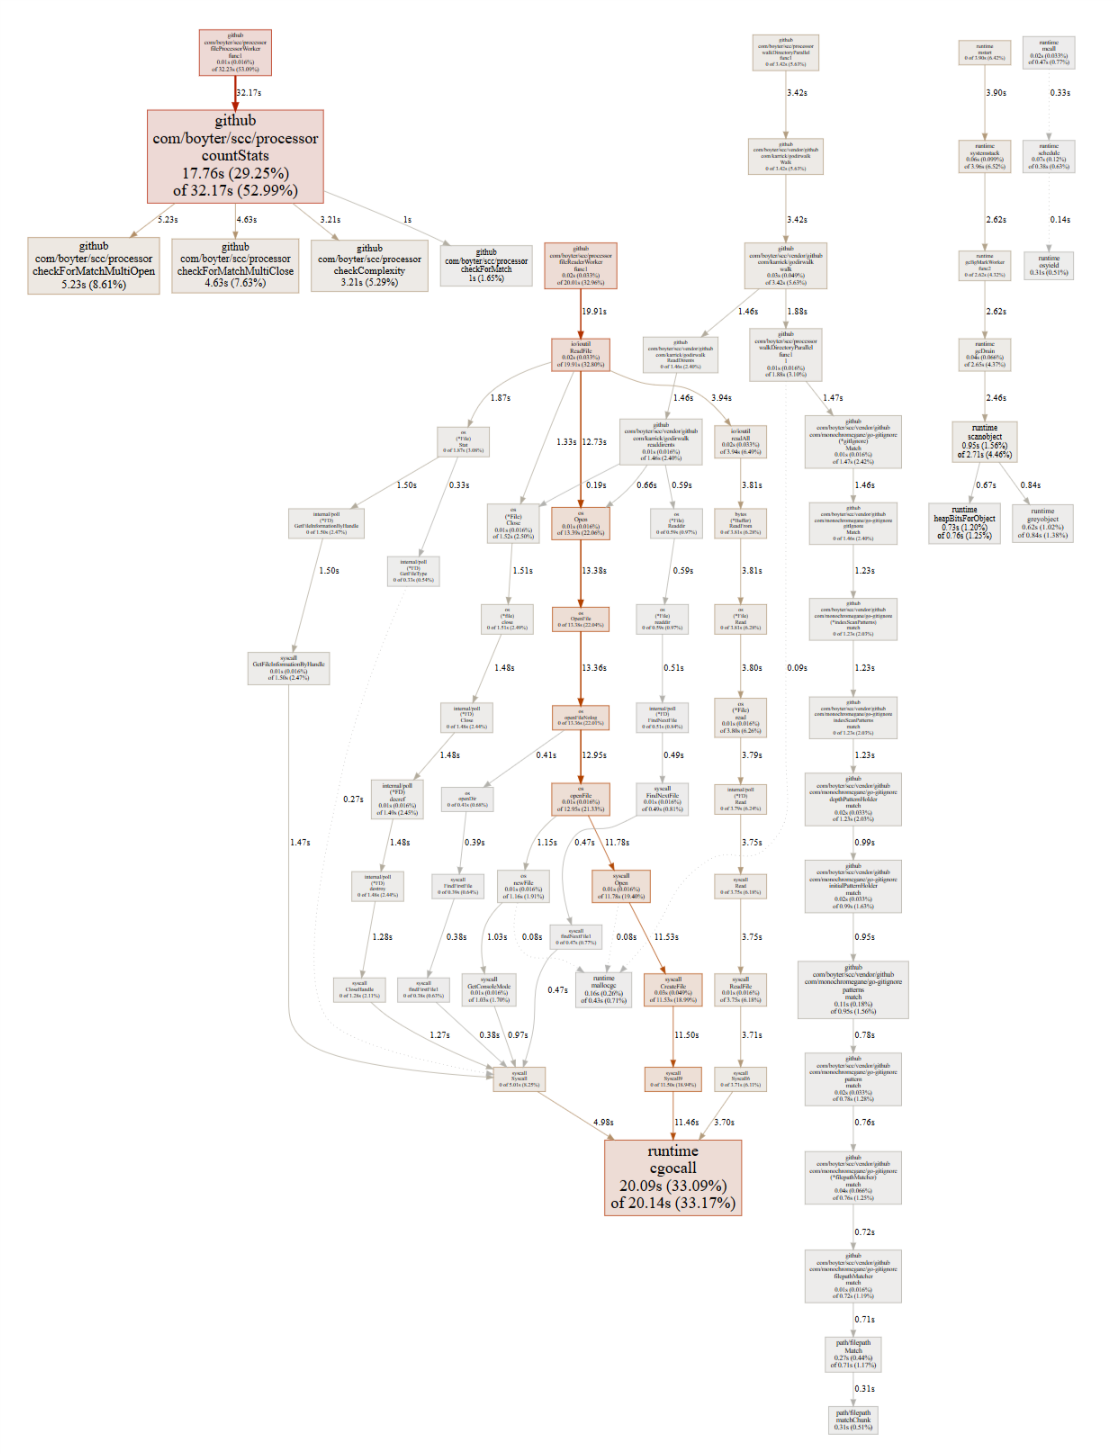
Checking profile output showed that rather unsurprisingly since my addition of the complexity calculation the core loop takes most of the time. In the below the core loop is the large box on the top left side named countStats.
Having a look at what I had in the core loop before I modified anything.
if currentState == S_BLANK && checkForMatch(currentByte, index, endPoint, singleLineCommentChecks, fileJob) {
  currentState = S_COMMENT
}

if currentState == S_CODE && checkForMatch(currentByte, index, endPoint, singleLineCommentChecks, fileJob) {
  currentState = S_COMMENT_CODE
}

if (currentState == S_BLANK || currentState == S_MULTICOMMENT || currentState == S_MULTICOMMENT_CODE) && checkForMatchMultiOpen(currentByte, index, endPoint, multiLineCommentChecks, fileJob) {
  currentState = S_MULTICOMMENT
  currentMultiLine++
}

if currentState == S_CODE && checkForMatchMultiOpen(currentByte, index, endPoint, multiLineCommentChecks, fileJob) {
  currentState = S_MULTICOMMENT_CODE
  currentMultiLine++
}

if (currentState == S_MULTICOMMENT || currentState == S_MULTICOMMENT_CODE) && checkForMatchMultiClose(currentByte, index, endPoint, multiLineCommentChecks, fileJob) {
  currentMultiLine--
  if currentMultiLine == 0 {
    currentState = S_MULTICOMMENT_CODE
  }
}

if currentState == S_BLANK && currentByte != ' ' && currentByte != '\t' && currentByte != '\n' && currentByte != '\r' {
  currentState = S_CODE
}

if (currentState == S_BLANK || currentState == S_CODE) && checkComplexity(currentByte, index, endPoint, complexityChecks, fileJob) {
  fileJob.Complexity++
}
In addition to being ugly there are a lot of if checks which are probably causing the slowdown, especially as many of them run even when not required. Thinking about the above there is one quick obvious win. If we have moved state I.E. switched from S_BLANK to S_CODE, then we don’t need to check the other conditions. Having a simple boolean to indicate that the state has changed and then skip over a lot of the checks will speed this up considerably. So I added that in and cut the runtime in half.
This was a good start but there is a lot more that can be done, not only to improve performance but to make the code far more readable.
- The first would be to change the logic so that we use a switch to jump to our current state and check what to do from there. This gives us the previous optimization for free and should make things easier to read.
- The other would be count the frequency of each of the above ifs. We want to order them such that we hit the change state condition as frequently as possible and bail out. In other words the order of the checks matters a great deal as you can use it to avoid hitting multiple if conditions.
I implemented the first which yielded some gains, but then realized I could convert the whole thing over to a large switch statement, which would jump to the current state and then do the checks just for that state. This would incorporate both of the above changes.
I changed over to the the switch statement, verified it worked as well as the skip checks implemented before and went back to profiling. Here is the the output looking at a run of the linux kernel once it has been warmed into disk cache.
(pprof) top10
Showing nodes accounting for 28.34s, 90.17% of 31.43s total
Dropped 225 nodes (cum <= 0.16s)
Showing top 10 nodes out of 80
      flat  flat%   sum%        cum   cum%
     9.89s 31.47% 31.47%      9.91s 31.53%  runtime.cgocall
     9.68s 30.80% 62.27%     16.85s 53.61%  github.com/boyter/scc/processor.countStats
     3.35s 10.66% 72.92%      3.35s 10.66%  github.com/boyter/scc/processor.checkForMatchMultiOpen
     3.32s 10.56% 83.49%      3.32s 10.56%  github.com/boyter/scc/processor.checkForMatchMultiClose
     0.78s  2.48% 85.97%      1.65s  5.25%  runtime.scanobject
     0.39s  1.24% 87.21%      0.39s  1.24%  github.com/boyter/scc/processor.checkComplexity
     0.39s  1.24% 88.45%      0.44s  1.40%  runtime.heapBitsForObject
     0.26s  0.83% 89.28%      0.36s  1.15%  runtime.greyobject
     0.16s  0.51% 89.79%      0.16s  0.51%  path/filepath.matchChunk
     0.12s  0.38% 90.17%      0.32s  1.02%  path/filepath.Match
Looking at the above you can see that the core loop function countStats is still close to the top, but that checkForMatchMultiOpen, checkForMatchMultiClose and checkComplexity are methods called by it that I wrote that would be worth investigating. A good sign is that cgocall is called almost as much as countStats so we are getting close to be bottlenecked by disk access and not the CPU.
The methods at first looked pretty tight. They all work by taking in a slice/list of things to check and then loop over the bytes inside them.
However there is the fact that they had a nested loop inside which is usually a problem. The method countComplexity for example works by taking in a slice and checking the current byte and potentially bytes beyond it for a matching condition. However it usually finds nothing, as it is unlikely that every byte is the start of a while loop. As such we are more likely to hit a negative condition than positive. To potentially speed things up we can check if the first character doesn’t match any of the first characters in the matches and if so bail out. This makes the best case of no matches faster at the expense of a few extra lookups for the worst case of a partial match.
Sounds good in theory. So I tried it out. I quickly added in the first bytes we want to look for to the code complexity calculation as below.
complexityBytes := []byte{
    'f',
    'i',
    's',
    'w',
    'e',
    '|',
    '&',
    '!',
    '=',
  }

  hasMatch := false
  for i := 0; i < len(complexityBytes); i++ {
    if complexityBytes[i] == currentByte {
      hasMatch = true
      break
    }
  }

  if !hasMatch {
    return false, 0
  }
A quick benchmark I ran showed that having a loop over 8 elements was much faster than a map so left it as a loop rather than a map.
And the results,
(pprof) top10
Showing nodes accounting for 49.46s, 89.12% of 55.50s total
Dropped 279 nodes (cum <= 0.28s)
Showing top 10 nodes out of 83
      flat  flat%   sum%        cum   cum%
    20.67s 37.24% 37.24%     20.70s 37.30%  runtime.cgocall
    17.41s 31.37% 68.61%     25.54s 46.02%  github.com/boyter/scc/processor.countStats
     4.06s  7.32% 75.93%      4.06s  7.32%  github.com/boyter/scc/processor.checkForMatchMultiOpen
     3.47s  6.25% 82.18%      3.47s  6.25%  github.com/boyter/scc/processor.checkForMatchMultiClose
     1.51s  2.72% 84.90%      2.93s  5.28%  runtime.scanobject
     0.76s  1.37% 86.27%      0.83s  1.50%  runtime.heapBitsForObject
     0.53s  0.95% 87.23%      0.53s  0.95%  runtime.osyield
     0.44s  0.79% 88.02%      0.44s  0.79%  github.com/boyter/scc/processor.checkComplexity
     0.31s  0.56% 88.58%      0.65s  1.17%  path/filepath.Match
     0.30s  0.54% 89.12%      0.60s  1.08%  runtime.greyobject
A nice optimization. The method checkComplexity is down in terms of cumulative call time.
Another change I added was that if there is a match in checkComplexity, checkForMatchMultiOpen or checkForMatchMultiClose it would return the number of bytes that the method had looked ahead. This allows us to jump ahead by that many bytes as we have already inspected them. This did however cause a new problem.
Turns out that allocations can be expensive when run in a tight loop. Look at the last line in the below where I return 0 with a new empty byte allocation used to indicate how long the match, and to know what to look for on the next loop
(pprof) list github.com/boyter/scc/processor.checkForMatchMultiOpen
Total: 50.30s
ROUTINE ======================== github.com/boyter/scc/processor.checkForMatchMultiOpen in C:\Users\bboyter\Documents\Go\src\github.com\boyter\scc\processor\workers.go
         .          .     77:   if !hasMatch {
     3.08s     11.05s     78:           return 0, []byte{}
The second value is not actually required in this case because we have no match. By changing it to a nil return we get the following profile, which is a massive improvement due to not having an allocation and by taking pressure off the garbage collector.
         .          .     77:   if !hasMatch {
     1.56s      1.56s     78:           return 0, nil
The below is a serious micro-optimization so be careful if you want to implement them yourself. Usually it means trading code reuse and readability for performance.
That said lets explore an interesting one. The following are 3 ways to compare if two byte slices are equal in Go.
equal := reflect.DeepEqual(one, two)equal := bytes.Equal(one, two)equal := true
for j := 0; j < len(one); j++ {
if one[j] != two[j] {
equal = false
break
}
}Which one would you think was the slowest? Which one the fastest? As you probably expected the slowest uses reflect. Reflection is almost always slow. However oddly enough the fastest is the basic for loop. Usually the answer to what is the fastest is whatever is in the standard library. However in this case the loop is able to avoid the length check required to see if the slices are the same length. This makes sense as it cannot assume that the slices are of the same length.
Also since in our case we already know that the first byte matches we can save some additional time by starting the loop at 1. How much of a saving does this produce?
BenchmarkCheckByteEqualityReflect-8                                      5000000               344 ns/op
BenchmarkCheckByteEqualityBytes-8                                       300000000                5.52 ns/op
BenchmarkCheckByteEqualityLoopWithAddtional-8                           500000000                3.76 ns/op
BenchmarkCheckByteEqualityLoop-8                                        500000000                3.41 ns/op
As you can see reflection is right out. However by using our own loop with the 1 byte offset we can get an additional saving. Extreme? Yes. But remember this happens in the core hot loop so these savings all add up. If you have very constrained requirements it can be worth checking to see if you can do better than the standard libraries.
Another thing I ran into was an odd method being called in the profile “duffcopy”. Did you know that range queries cause additional allocations? It appears when you profile as “duffcopy” https://stackoverflow.com/questions/45786687/runtime-duffcopy-is-called-a-lot switching from range to index lookups can buy you a lot of performance if you are running very tight loops.
Also in the profile were many calls to Sprintf. This was caused by my trace and debug logic. Wrapping it with an if statement looks ugly but solves the issue as it is extremely friendly to the branch predictor and saves some string allocations.
if Trace {
    printTrace(fmt.Sprintf("%s line %d ended with state: %d", fileJob.Location, fileJob.Lines, currentState))
}
Another place to save some time was to add caches for certain actions. An example would be getting the extension of a file. Its pretty common to have multiple files with the same name. As such a cache to save the processing can dramatically speed things up at the expense of some memory. A simple benchmark shows that the gains are not insignificant.
BenchmarkGetExtensionDifferent-8                                          200000              6077 ns/op
BenchmarkGetExtensionSame-8                                             10000000               138 ns/op
The final thing I looked to optimize was the printing code. While generally it was not an issue I noticed that if the files option was used it would take a considerable amount of time processing the lists. I was using https://github.com/ryanuber/columnize/ for this and while it worked well the additional overhead was a problem. I poked through the code and the slowdown was because it takes in any length and stuffs the values into a column it needs to loop the input a few times in order to know output sizes.
However I could work out the sizes in advance, or just define them and avoid those additional loops. As such I rolled my own formatter. Well aware that string concatenation is usually very slow, a quick search showed that https://stackoverflow.com/questions/1760757/how-to-efficiently-concatenate-strings-in-go there are quite a few ways to do it in Go. Thankfully someone included a benchmark of the common ways to do it.
BenchmarkConcat-8                1000000             64850 ns/op
BenchmarkBuffer-8               200000000                6.76 ns/op
BenchmarkCopy-8                 1000000000               3.06 ns/op
BenchmarkStringBuilder-8        200000000                7.74 ns/op
Based on the above I decided to go with the Go 1.10 specific method and use string builder. Its almost as fast as buffer and copy but much easier to understand. Since the formatting happens at the very end with only a few iterations for the summary and with what can be done as results come in for the files options there is no real need to over complicate things. It also ensures that scc can only be built with a modern Go compiler so we get at least a decent level of baseline performance.
I wrote my own little benchmark over the formatters method to ensure I didn’t make things slower and converted it over.
// When using columise  ~28726 ns/op
// When using optimised ~14293 ns/op
Switching out to a custom formatter method was about half the amount of operations and as such about twice as fast. It also allowed me to add line breaks to the output which was missing functionality in columize.
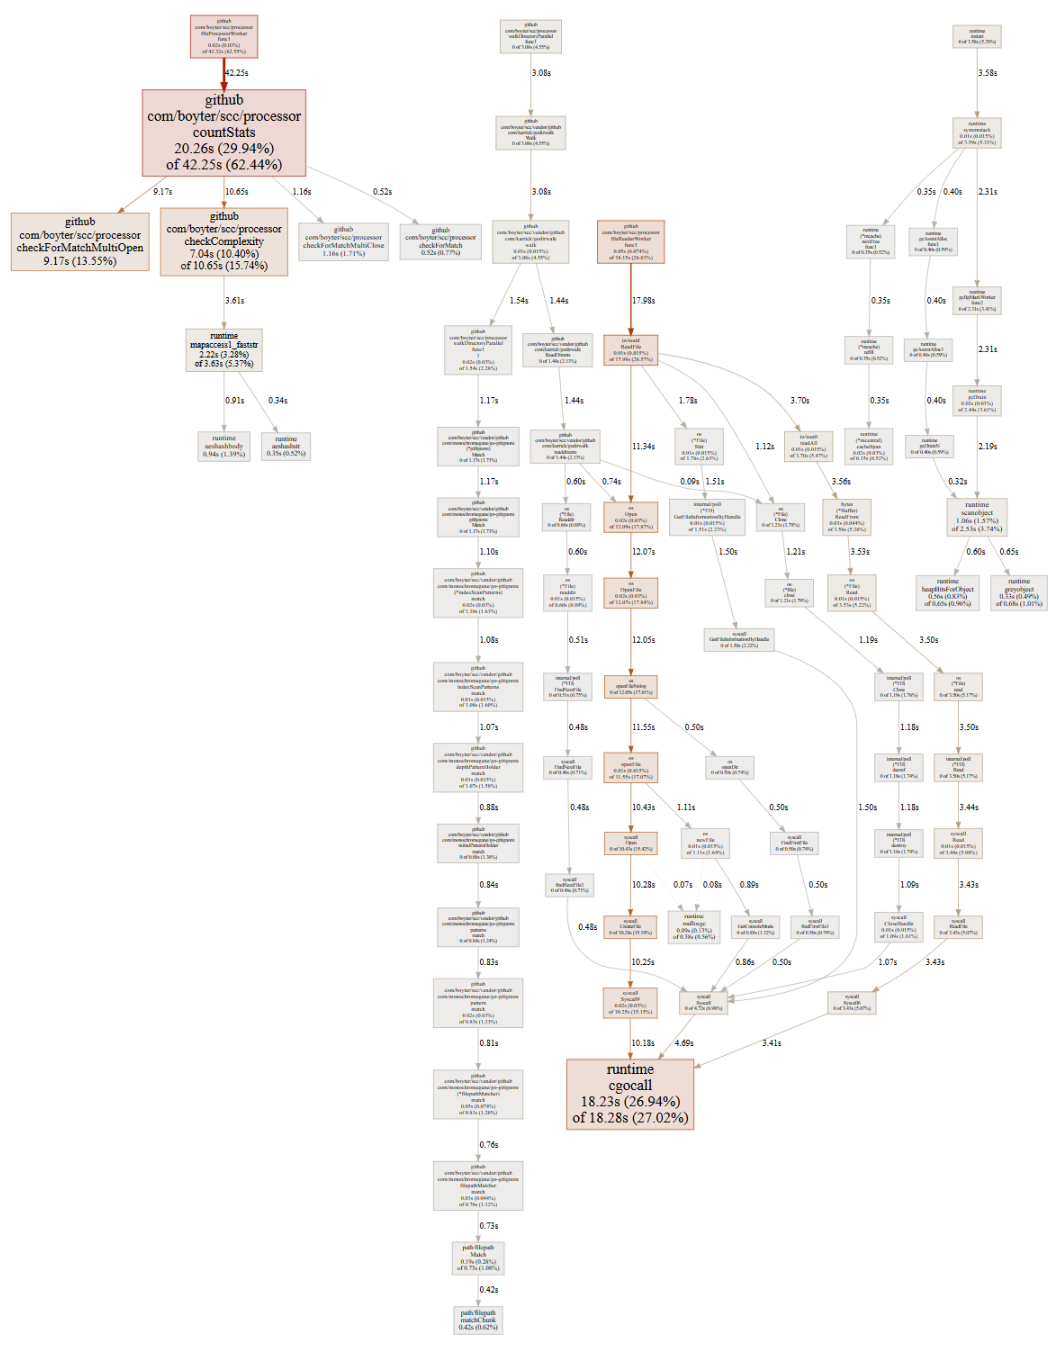
So after all of the above the final profile ended up looking like the below. The countStats box is now pretty close to the cgocall and the times are fairly close. The application is still CPU bound with a warm disk cache, but not by much. Most of the time of the hot loop is in the complexityCheck method is about as efficient as I know how to write it.
Example Output
Of course everything is about the output and what you actually get with it. With everything working the output looks like the below of a basic calculation of the redis source code.
$ scc redis
-------------------------------------------------------------------------------
Language                 Files     Lines     Code  Comments   Blanks Complexity
-------------------------------------------------------------------------------
C                          215    114488    85341     15175    13972      21921
C Header                   144     20042    13308      4091     2643       1073
TCL                         93     15702    12933       922     1847       1482
Lua                         20       524      384        71       69         66
Autoconf                    18     10713     8164      1476     1073        986
Shell                       18       810      513       196      101        102
Makefile                     9      1021      716       100      205         50
Ruby                         8      2416     1798       376      242        365
Markdown                     6      1312      964         0      348          0
HTML                         6     11472     8288         5     3179          0
YAML                         2        75       60         4       11          4
CSS                          2       107       91         0       16          0
C++ Header                   1         9        5         3        1          0
Batch                        1        28       26         0        2          3
Plain Text                   1       499      499         0        0          0
C++                          1        46       30         0       16          5
-------------------------------------------------------------------------------
Total                      545    179264   133120     22419    23725      26057
-------------------------------------------------------------------------------
Estimated Cost to Develop $4,592,517
Estimated Schedule Effort 27.382310 months
Estimated People Required 19.867141
-------------------------------------------------------------------------------
In order to evaluate how well the complexity calculation works I tried it against my personal project searchcode server http://github.com/boyter/searchcode-server where I would expect that the files SearchCodeLib, IndexService and CodeMatcher to be the most complex based on what I know about the code-base.
$ scc --wl java --files -s complexity searchcode-server
-------------------------------------------------------------------------------
Language                 Files     Lines     Code  Comments   Blanks Complexity
-------------------------------------------------------------------------------
Java                       131     19445    13913      1716     3816       1107
-------------------------------------------------------------------------------
~e/app/util/SearchCodeLib.java       616      418        90      108        108
~app/service/IndexService.java      1097      798        91      208         96
~/app/service/CodeMatcher.java       325      234        41       50         66
~service/TimeCodeSearcher.java       582      429        49      104         65
~ce/route/ApiRouteService.java       394      293        12       89         63
~de/app/service/Singleton.java       335      245        20       70         53
~rchcode/app/util/Helpers.java       396      299        38       59         52
~e/route/CodeRouteService.java       453      348         9       96         50
Indeed that is exactly what I would have expected from the results. So it looks for at least for my use case that the complexity calculations work pretty well. Of course if you don’t want them,
$ scc -c --co redis
-------------------------------------------------------------------------------
Language                     Files       Lines      Code    Comments     Blanks
-------------------------------------------------------------------------------
C                              215      114480     85333       15175      13972
C Header                       144       20042     13308        4091       2643
TCL                             93       15702     12933         922       1847
Lua                             20         524       384          71         69
Autoconf                        18       10713      8164        1476       1073
Shell                           18         810       513         196        101
Makefile                         9        1021       716         100        205
Ruby                             8        2422      1804         376        242
Markdown                         6        1312       964           0        348
HTML                             6       11472      8288           5       3179
YAML                             2          75        60           4         11
CSS                              2         107        91           0         16
Batch                            1          28        26           0          2
C++ Header                       1           9         5           3          1
C++                              1          46        30           0         16
Plain Text                       1         499       499           0          0
-------------------------------------------------------------------------------
Total                          545      179262    133118       22419      23725
-------------------------------------------------------------------------------
Not only can you turn off the complexity calculations you can turn off the COCOMO output as well.
Note that the calculations will not be 100% the same as tokei for a few reasons.
- scc picks up additional languages and file types
- scc will always count blank lines in a file even if it is not counting code or comments
- there are some differences in how they both behave with newlines with tokei counting \n similar to wc
I coded scc to work with how I wanted it to work. Perhaps in the future a flag can be added to bring them into line if someone wants to put the work in.
Benchmarks
What follows is going to be a highly biased (I wrote one of the tools remember) collection of benchmarks that show while scc is not the fastest code counter on Linux (that honour is held by Tokei) it gets very close. It is however the fastest on Windows and OSX. In either case it is considerably faster than cloc, sloccount, loc and gocloc. It is the only code counter that is fast, accurate and supports removing duplicate files. Lastly it is also the only code counter that performs complexity calculations for you.
In addition you can have the code complexity calculation running with or without duplicates detection and it will generally be almost as fast as tokei.
With those outrageous claims out of the way lets see if I prove them.
Methodology / Commands
All GNU/Linux tests were run on Digital Ocean 16 vCPU Compute optimized droplet with 32 GB of RAM and a 200 GB SSD. The machine used was doing nothing else at the time and was created with the sole purpose of running the tests to ensure no interference from other processes. The OS used is Ubuntu 16.04 and the rust programs were installed using cargo install.
Keep in mind that this is not a dedicated machine. As such it is subject to noisy neighbors and issues with the underlying hardware. It is likely you will be unable to replicate the results 100% even if you spin up the same instance.
The Windows tests were run on a Surface Book 2 with the i7-8650U CPU. This is problematic as there is the possibility that CPU throttling will kick in influencing the benchmark, and as it is not a freshly formatted machine that there may be something else running on it during the benchmark. Take these tests with a massive grain of salt and treat them as more an indication of performance than a perfect benchmark. I did my best to stop all background services and ran benchmarks several times only taking the best result for each to try and keep it as fair as possible. I ran the tests inside the Ubuntu WSL which means I was running Linux binaries in Windows which probably causes odd results as well.
The macOS tests were run on a 2013 Macbook Pro Retina macOS Sierra 10.12.6. The tests were only run on Redis and Django as the Laptop was a loaner and I did not have time to get a copy of the Linux Kernel. Similar to the problems of the Surface Book 2 a new account was created on this to ensure as few background processes were running as possible. As it was a loaner I only had time to try out scc and tokei on it.
I set scc to run first in order to ensure that it warms up everything and take any handicap that might incur from this process. To do the benchmark itself I used the excellent Rust tool hyperfine with 3 warm-up runs and 10 timed runs total to produce the results. These are the defaults for hyperfine but are set explicitly via the command line.
Due to how long sloccount and cloc took I have only run benchmarks of them for redis as it took far too long to get the results for the larger projects.
Tools under test
- scc 1.0.0
- tokei 7.0.1
- loc 0.4.1
- gocloc (no version) commit
#686bf36768b8d00e355be00c445df681a2a88125 - sloccount 2.26
- cloc 1.60
To keep things fair I also ran scc three times for each benchmark. The first was in its default options, the second without code complexity calculations and the last with duplicates detection enabled. This is because none of the other tools under test have code complexity calculations and some tools such as sloccount do detect and remove duplicate results.
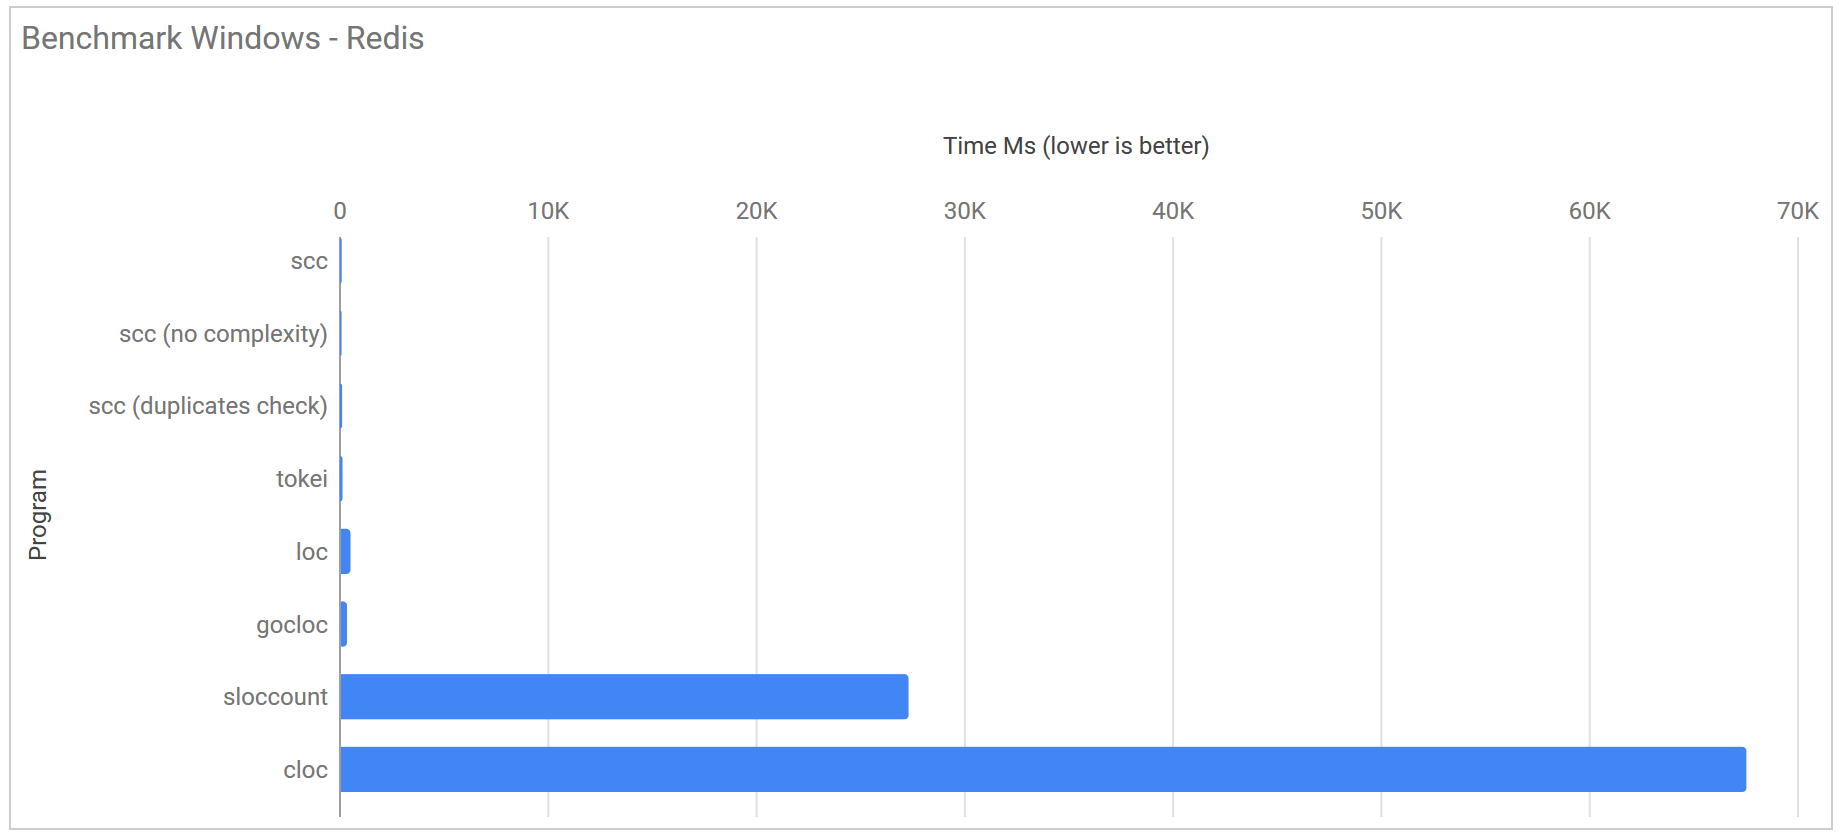
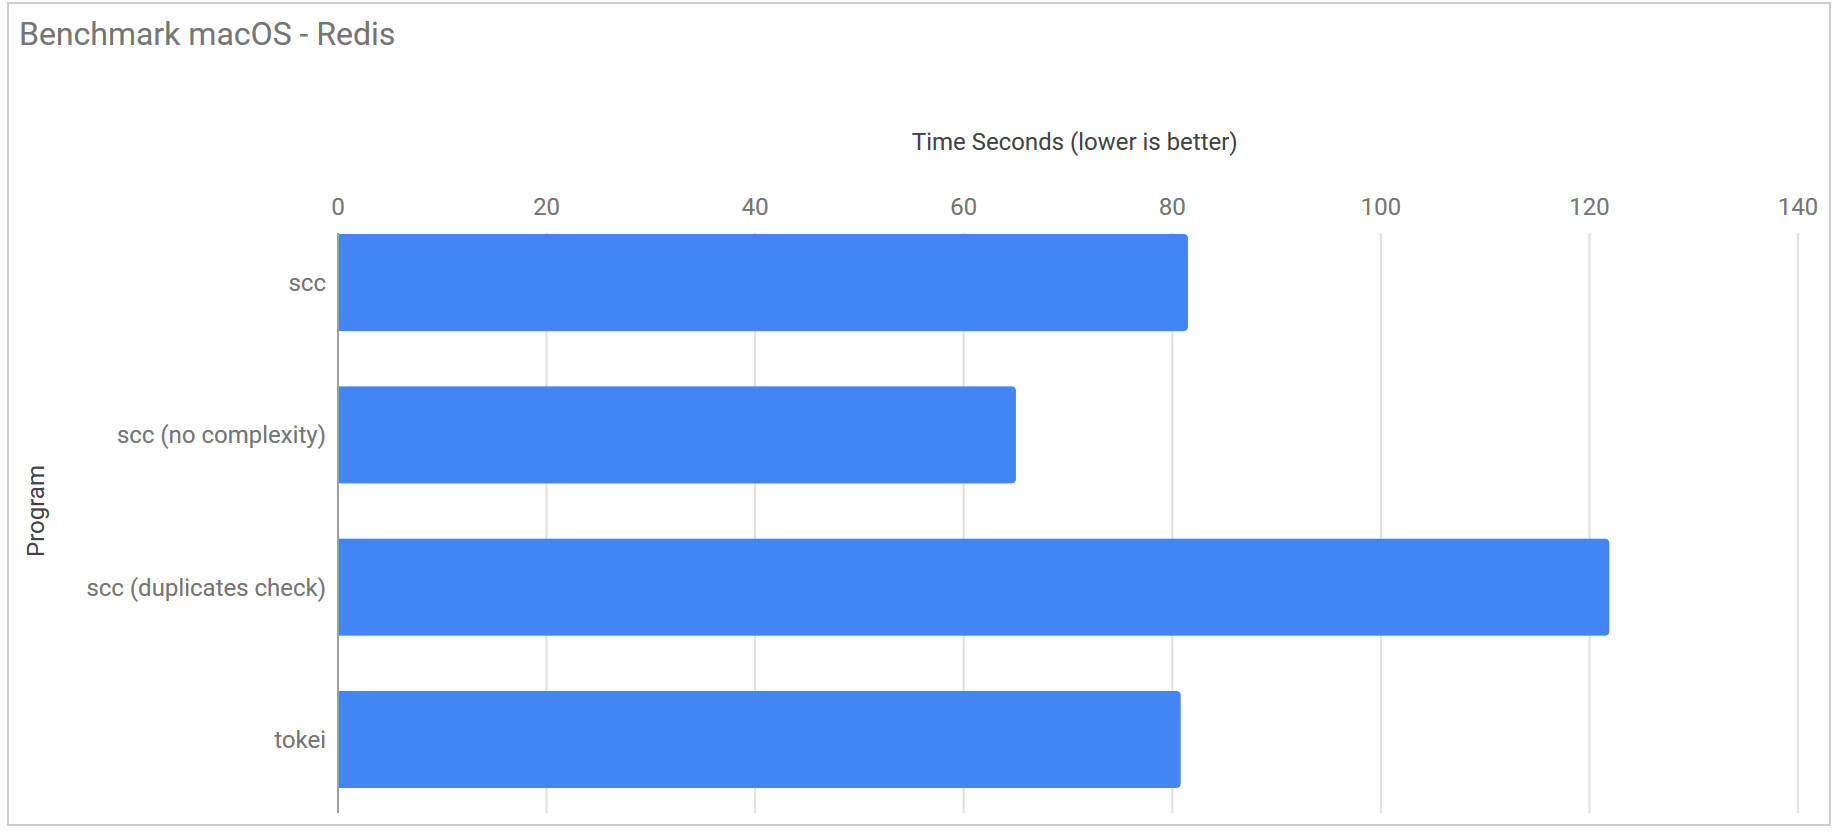
Redis Source Benchmarks
The first test was run against the redis code https://github.com/antirez/redis/ commit #7980d87c3c72740f4609fdcaae088221f8f8eb59 With ~180,000 lines of code in its code-base it represents a reasonable sized project that someone may want to calculate code stats for.
| Program | Linux | Windows (WSL) | macOS |
|---|---|---|---|
| scc | 36.7 ms ± 16.7 ms | 79.2 ms ± 2.4 ms | 81.6 ms ± 3.6 ms |
| scc (no complexity) | 36.4 ms ± 13.6 ms | 74.0 ms ± 2.3 ms | 65.1 ms ± 2.7 ms |
| scc (duplicates check) | 56.5 ms ± 21.3 ms | 99.4 ms ± 3.2 ms | 122.0 ms ± 3.1 ms |
| scc (no GC no complexity) | 13.4 ms ± 2.9 ms | 72.5 ms ± 5.0 ms | N/A |
| tokei | 28.1 ms ± 5.4 ms | 118.8 ms ± 4.1 ms | 80.9 ms ± 3.8 ms |
| loc | 147.7 ms ± 40.4 ms | 549.8 ms ± 10.6 ms | N/A |
| gocloc | 117.0 ms ± 1.9 ms | 383.5 ms ± 12.1 ms | N/A |
| cloc | 1.485 s ± 0.033 s | 67.568 s ± 10.167 s | N/A |
| sloccount | 854.8 ms ± 20.5 ms | 27.345 s ± 3.384 s | N/A |
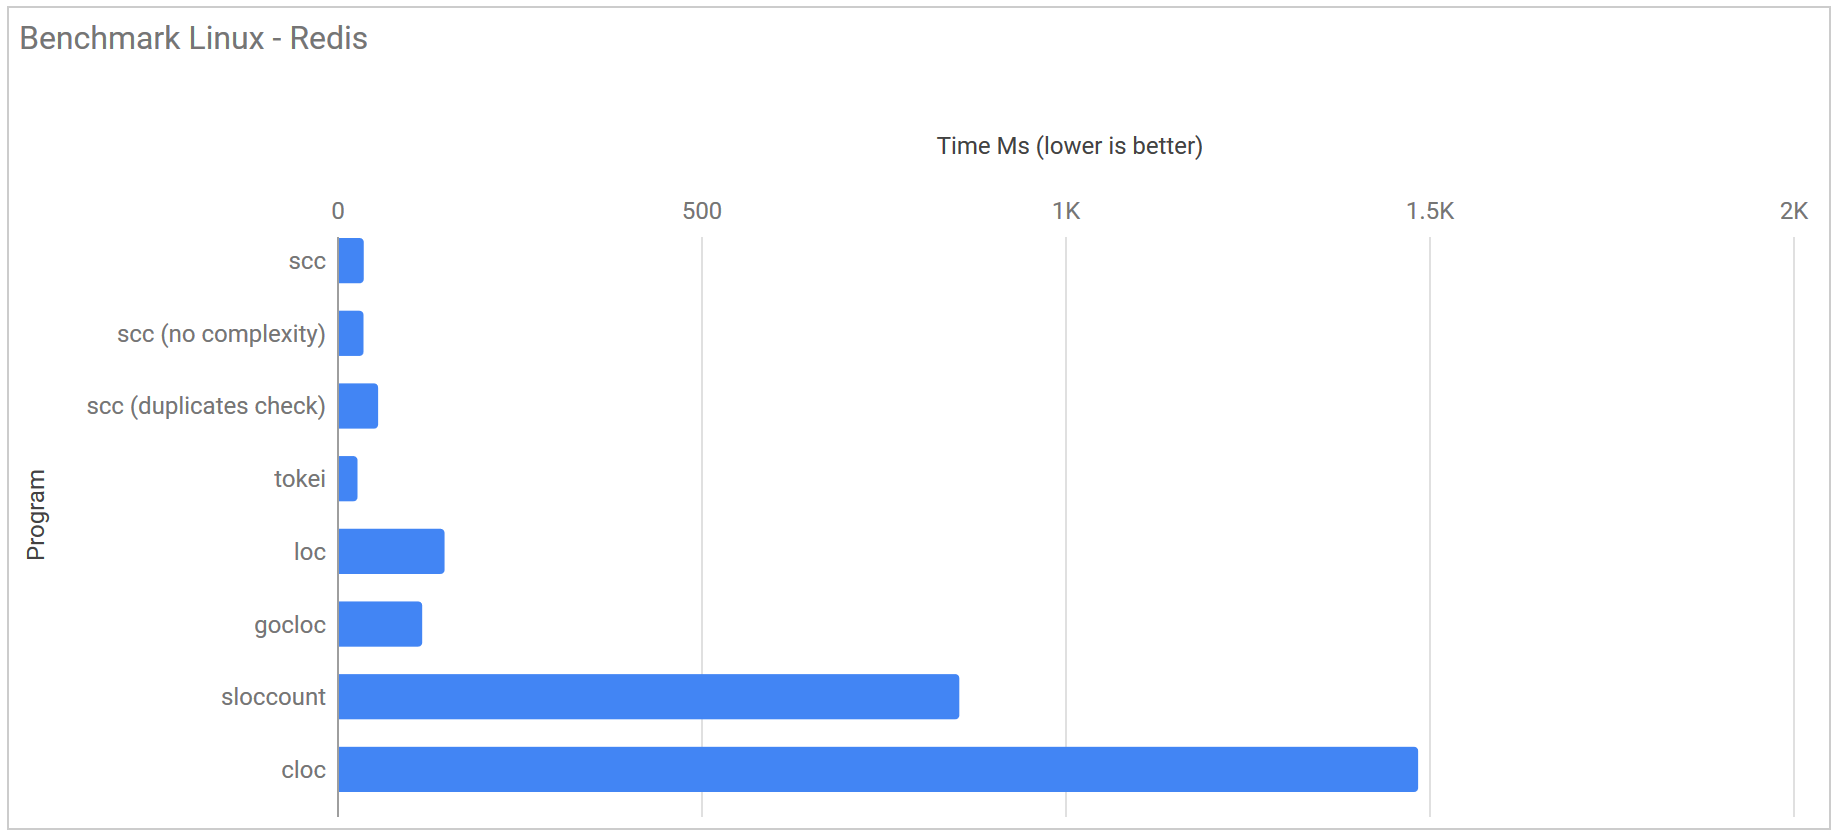
For GNU/Linux by default Tokei is the fastest code counter by ~10 ms. The removal of the code complexity check for scc brings almost no added performance. This is due to there not being enough code to to have an impact. If you disabled the garbage collector for scc it flies and is almost 2x a fast as Tokei. The good news is that any of the newer projects are at least 8x faster than cloc or sloccount.
On Windows the story is rather different. Not only is scc faster than everything else, its faster even using default settings or when adding duplicate detection. I must admit I am very impressed with how well the WSL works on Windows. The thing I find most interesting is that there is less variation between the runs.
macOS has a similar story to Windows. What is nice to see here is that you can clearly see the impact of not calculating the complexity and calculating the duplicates. I suspect this is mostly down to the test macOS machine having by far the weakest CPU in the lineup.
Django Source Benchmarks
I chose to run the next benchmark using commit #9a56b4b13ed92d2d5bb00d6bdb905a73bc5f2f0a of the Django project. With ~500,000 lines it is about four times the size of Redis.
| Program | Linux | Windows (WSL) | macOS |
|---|---|---|---|
| scc | 119.2 ms ± 32.7 ms | 637.8 ms ± 15.2 ms | 324.6 ms ± 8.9 ms |
| scc (no complexity) | 128.8 ms ± 30.4 ms | 652.3 ms ± 14.4 ms | 270.6 ms ± 13.2 ms |
| scc (duplicates check) | 171.1 ms ± 37.1 ms | 728.3 ms ± 35.3 ms | 460.5 ms ± 14.8 ms |
| scc (no GC no complexity) | 50.6 ms ± 6.4 ms | 647.9 ms ± 16.5 ms | N/A |
| tokei | 99.1 ms ± 6.1 ms | 914.7 ms ± 17.1 ms | 284.2 ms ± 17.6 ms |
| loc | 282.2 ms ± 42.9 ms | 20.058 s ± 1.731 s | N/A |
| gocloc | 340.6 ms ± 3.0 ms | 3.201 s ± 0.595 s | N/A |
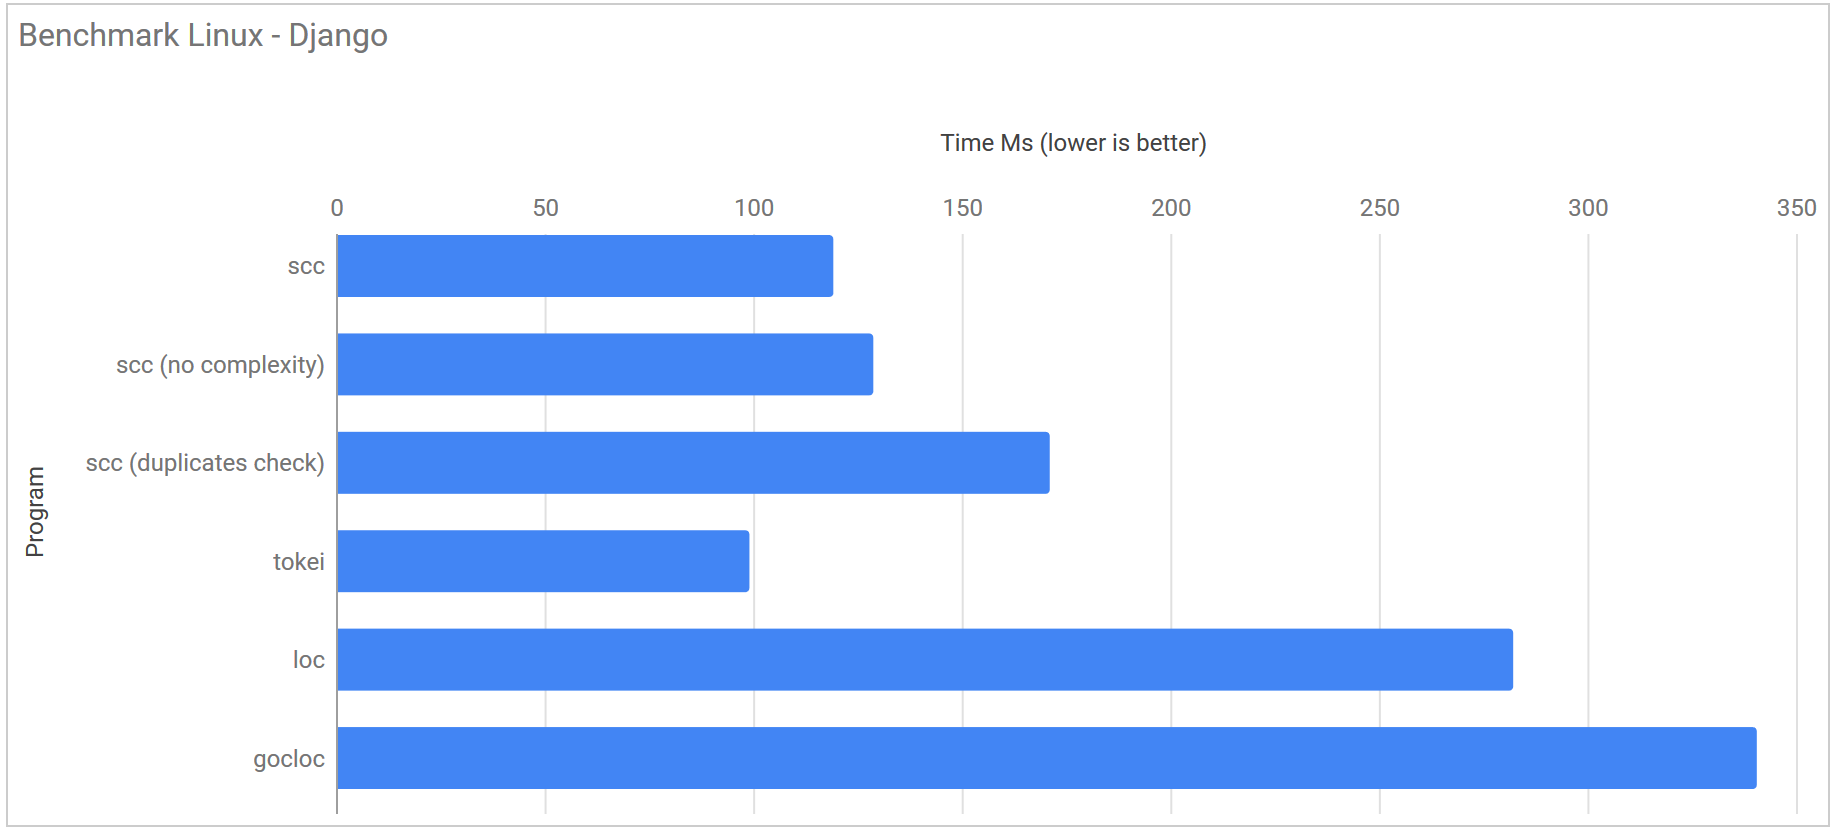
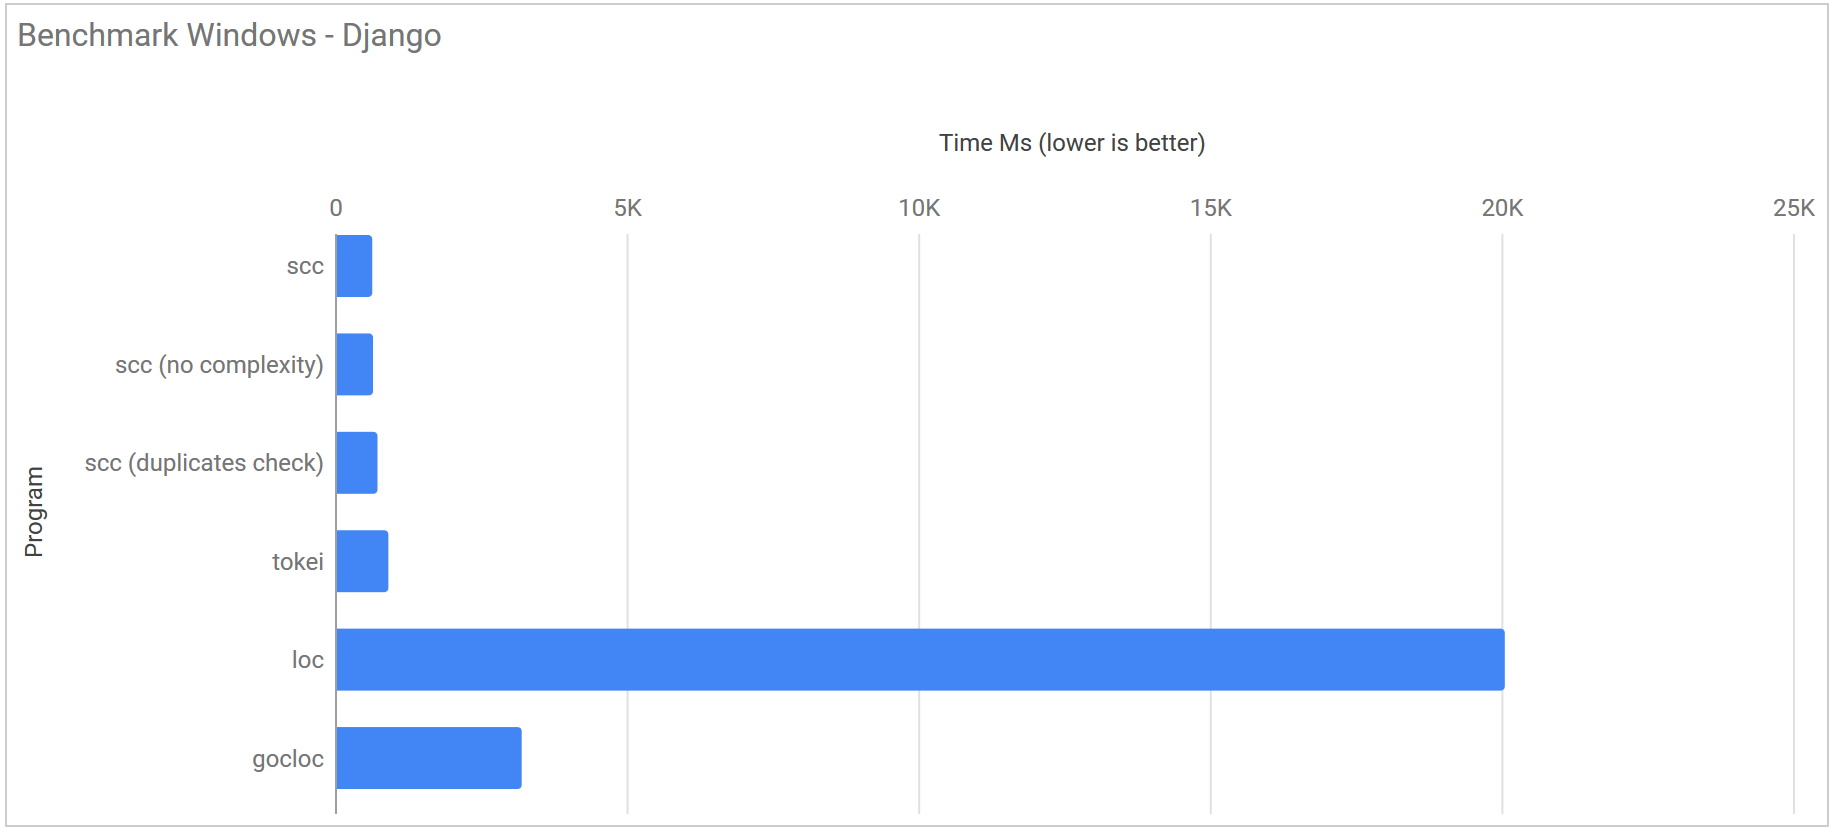
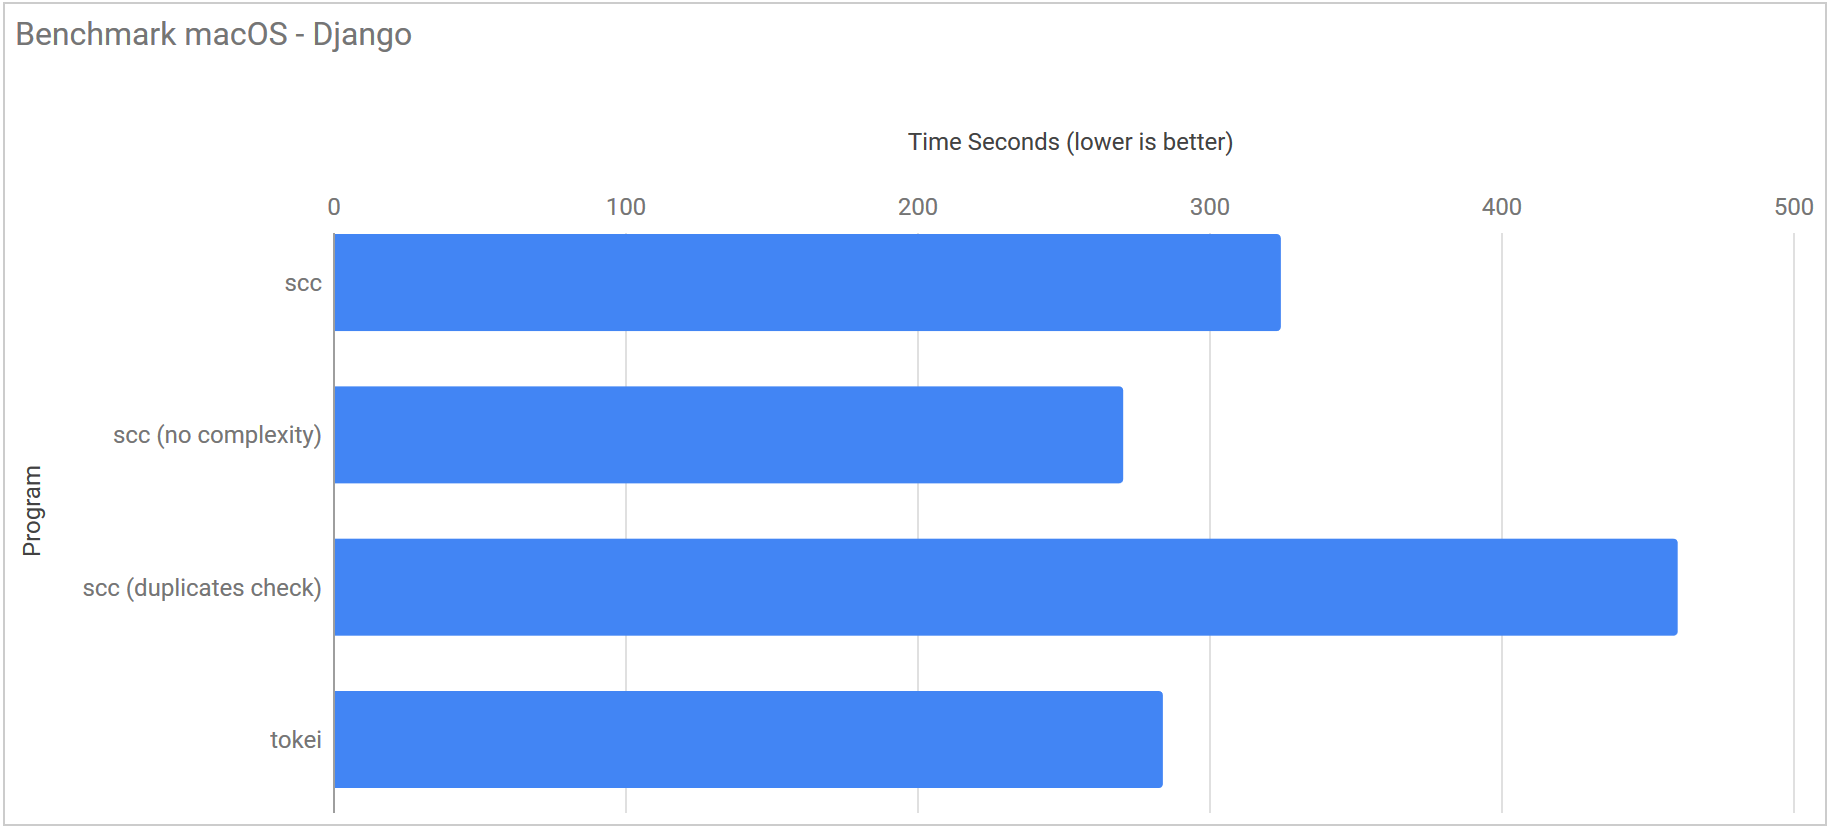
Again you can see that tokei is the fastest on Linux but not by much and that scc pulls away on Windows and macOS. Again if you disable the garbage collector scc is about twice as fast as tokei.
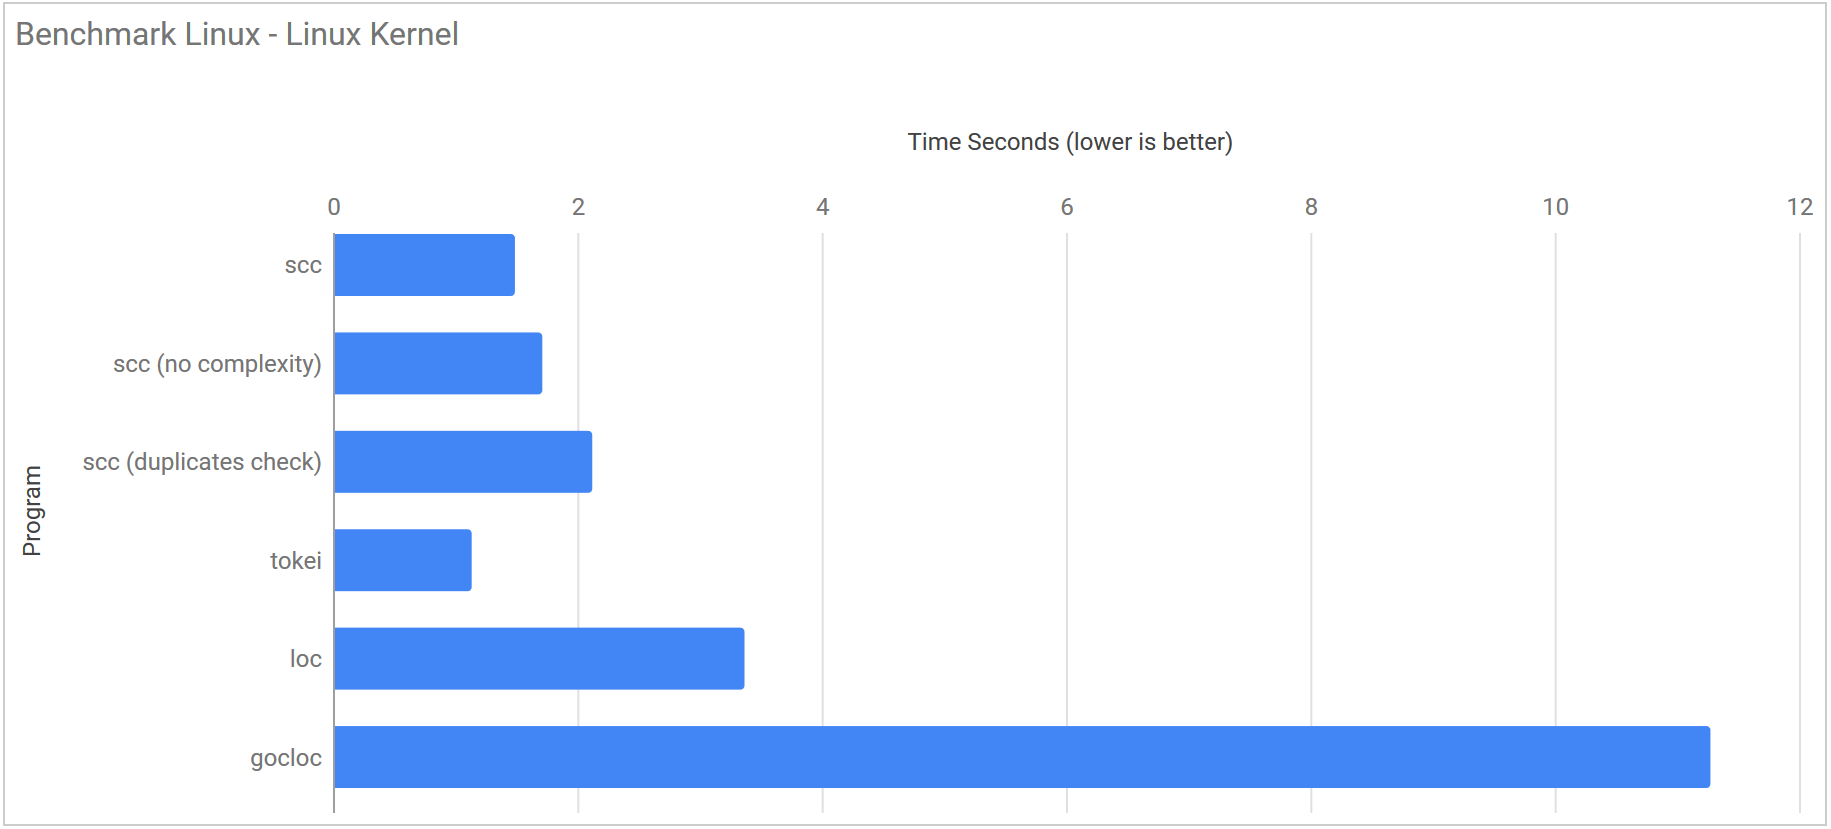
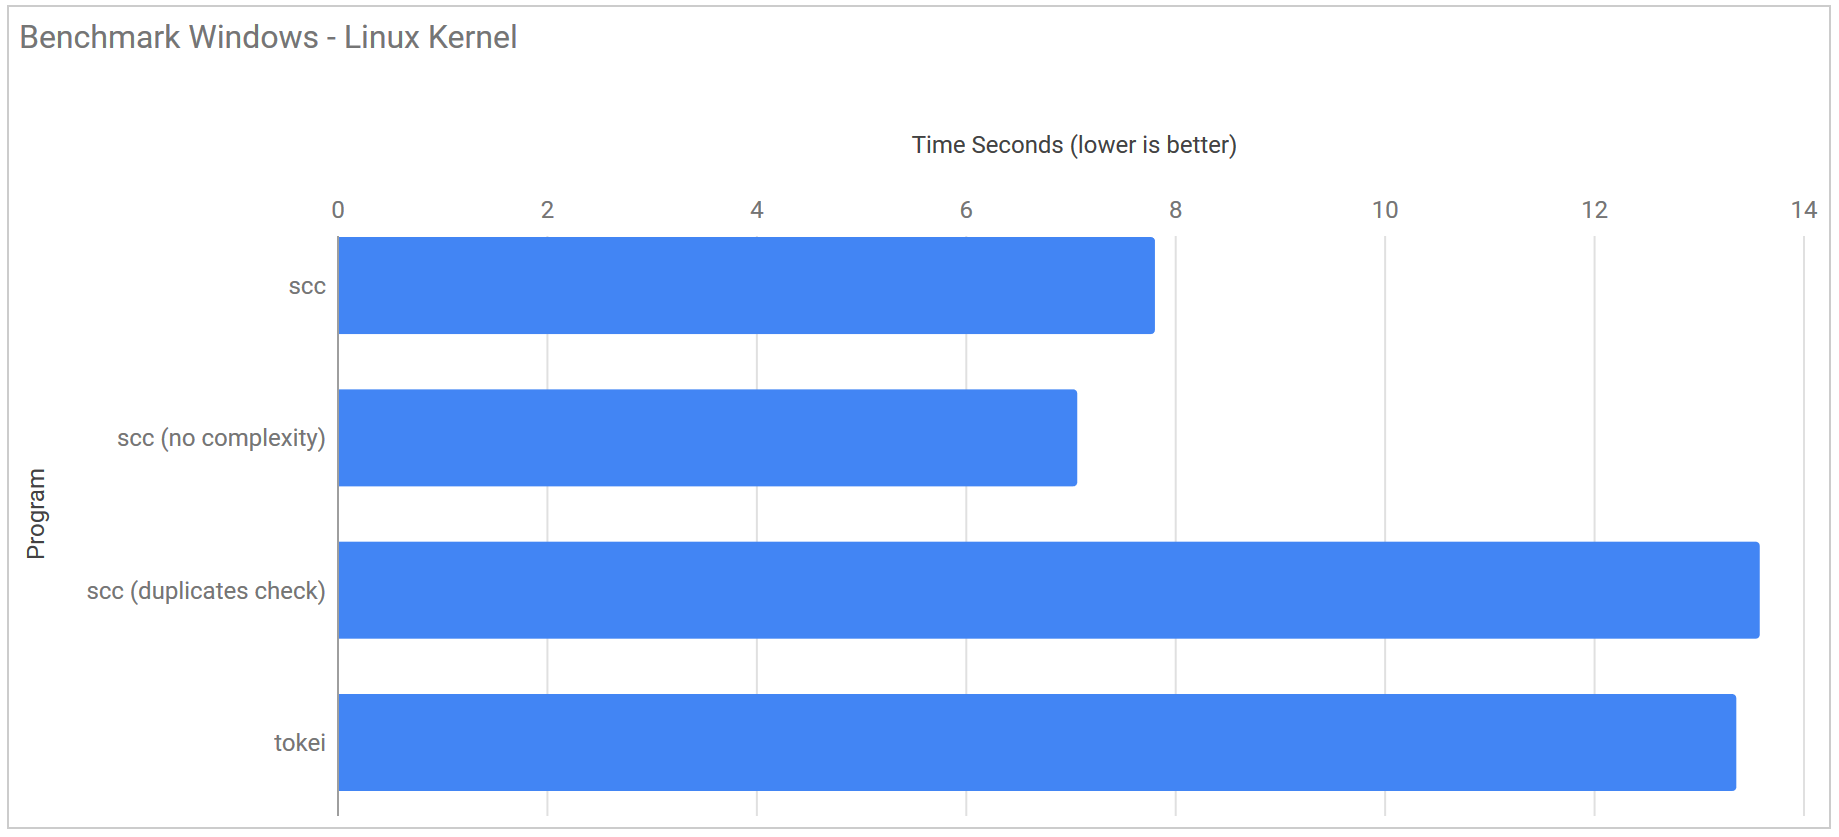
Linux Kernel Source Benchmarks
The Linux Kernel benchmark was run using a fresh checkout of the Linux kernel commit #48023102b7078a6674516b1fe0d639669336049d and with its ~23,000,000 lines of code is about 40x the size of Django. The linux kernel is by no means the largest software project around but it is still huge and should push each of the programs to their limits.
I gave up running loc and gocloc on Windows as both were taking greater than 3 minutes to run.
| Program | Linux | Windows |
|---|---|---|
| scc | 1.489 s ± 0.055 s | 7.811 s ± 0.307 s |
| scc (no complexity) | 1.713 s ± 0.157 s | 7.069 s ± 0.854 s |
| scc (duplicates detection) | 2.122 s ± 0.054 s | 13.587 s ± 1.647 s |
| scc (no GC no complexity) | 0.744 s ± 0.167 s | 7.213 s ± 0.130 s |
| tokei | 1.135 s ± 0.074 s | 13.363 s ± 1.262 s |
| loc | 3.368 s ± 0.452 s | DNF |
| gocloc | 11.275 s ± 0.062 s | DNF |
However a single count of the kernel was not enough for me. Just to push them to work that much harder I made ten copies in a single directory and timed the tools counting that. I did not run this test under Windows as it was really just to see how the counters work with extremely large code bases.
| Program | Linux |
|---|---|
| scc | 11.665 s ± 0.200 s |
| scc (no complexity) | 8.768 s ± 1.017 s |
| scc (duplicates detection) | 16.902 s ± 1.685 s |
| scc (no GC no complexity) | 6.843 s ± 0.058 s |
| tokei | 9.752 s ± 0.239 s |
| loc | 22.363 s ± 3.075 s |
| gocloc | 32.664 s ± 0.140 s |
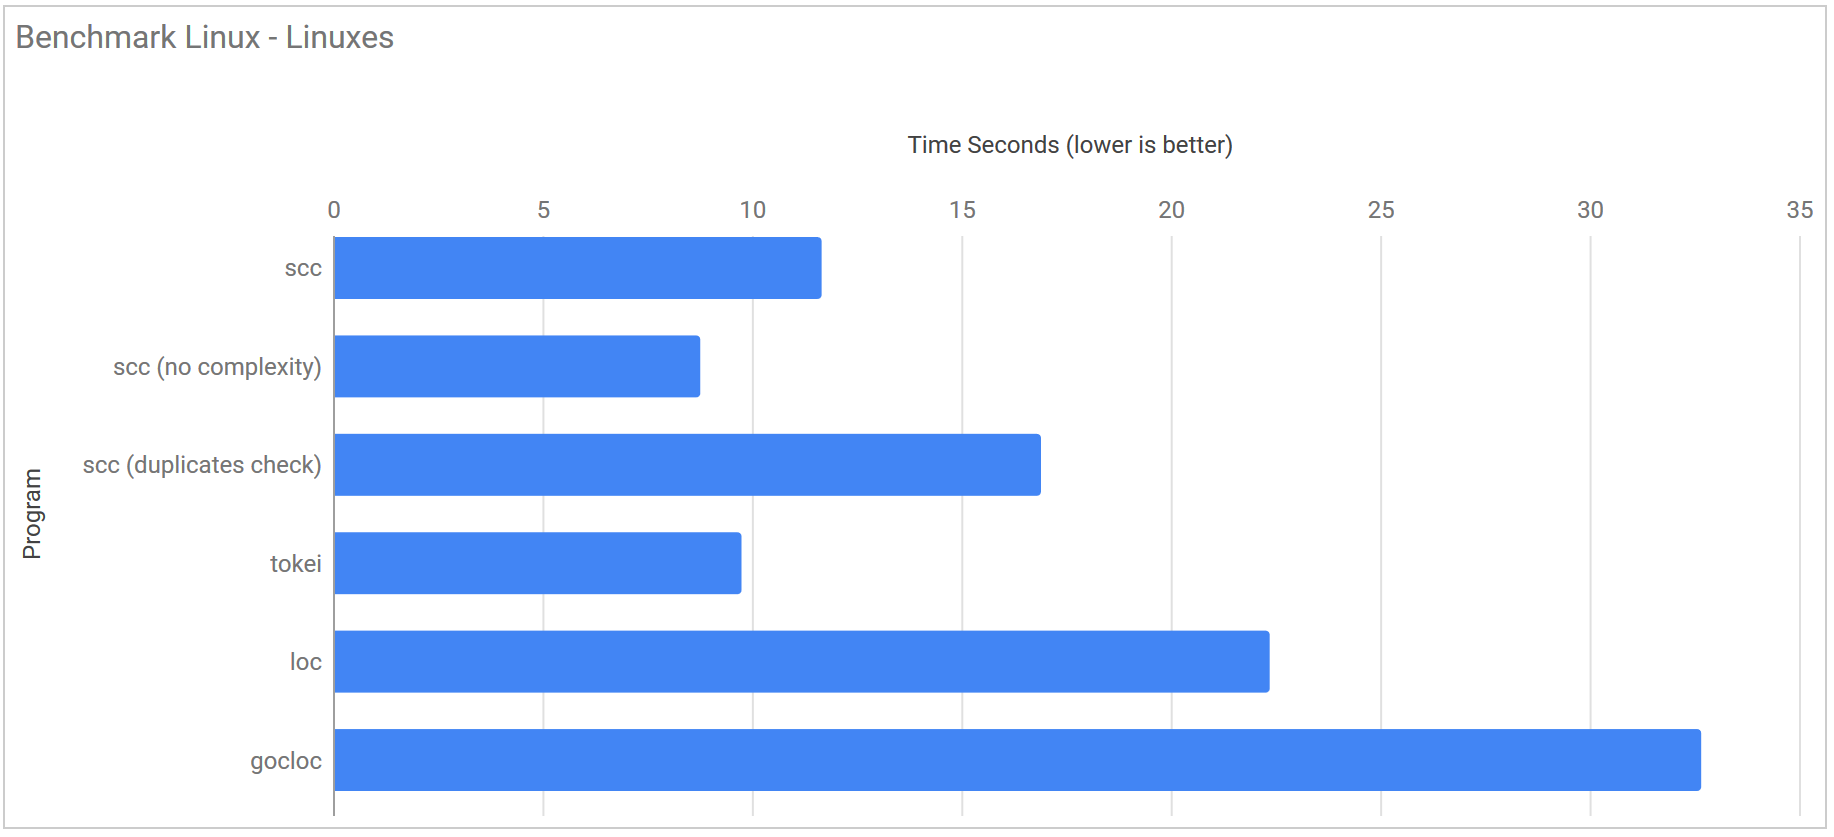
That scc managed to beat tokei here makes me suspect that the differences in performance between tokei and scc are mostly down to how they walk through the file system. If true then it may be possible to modify scc to be faster or equal to tokei in all of the other tests if I were to explore parallel walking of the file tree more.
Conclusion
Disappointingly I never managed to get scc to run as fast as tokei for the majority of tests on Linux. This appears to be totally down to the garbage collector based on my experiments disabling it. As such it’s unlikely it will ever match unless something radical happens in the Go compiler. I suspected this would be the case when I started coding but had hoped that the authors of it may have missed some simple optimizations. This turned out not to be the case, so hats off to the authors of tokei. However if you do want the fastest code counter possible, and have RAM to spare just run it like so GOGC=-1 scc -c . for a massive speed improvement.
I have to wonder just how much the Windows WSL held me back here however. It is an excellent piece of software and makes coding on Windows an absolute joy again. However I suspect that as I did all my profiling inside Windows and not Linux I may have missed out on optimizations that would be linux specific. If someone wants to do some work profiling in Linux and submit a PR to fix what I have probably missed for this I would really appreciate it. If I get time I may try this myself on my desktop machine.
The claims of loc to be faster than tokei appear to only hold true on single/dual core systems. The only way I could get loc to run faster than tokei was to run it on a single core machine or restricted it to a few cores using taskset. This suggests that the parallel code in loc is not efficient. In fact checking htop output while it is running on the test VM showed that most cores were underutilized. Since loc does not attempt to determine if code is in a string quote or not, if this was resolved I would expect it to run faster than tokei.
| Program | Runtime |
|---|---|
taskset 0x01 scc django |
1.362 s |
taskset 0x01 tokei django |
1.311 s |
taskset 0x01 loc django |
1.115 |
It is interesting to note how much stronger the Rust compiler/tool-chain is on Linux compared to Windows and macOS. By contrast the Go compiler seems to produces very efficient results no matter where it is run, even if it’s performance is not quite up-to what Rust can produce in an ideal situation. Its a strength of Go that you can write code that works well on one architecture and be fairly confident it will work well elsewhere.
Of course whats likely to happen now is that either the excellent authors of Tokei, Loc or Gocloc are going to double down on performance or someone else far smarter than I is going to show of their Rust/C/C++/D skills and implement a parser thats much faster than scc with duplicate detection and maybe complexity calculations. I would expect it to also be much faster than anything I could ever produce. It’s possible that Tokei and Loc could run faster already just by compiling for the specific CPU they run on or through the SIMD optimizations that at time of writing are still to hit the main-line rust compiler.
I have no problem with this. A lot of this post was about seeing how fast I could make things run while learning as much as possible. Besides I don’t think of tools that do similar things as being in competition. Andy Lester of ack fame puts this far better than I ever could http://blog.petdance.com/2018/01/02/the-best-open-source-project-for-someone-might-not-be-yours-and-thats-ok/
If you do like SCC though feel free to submit some pull requests. The language.json file could use some traditional submissions of languages and improvements to the languages that are already are in there. If you are able to find some additional performance somewhere in the code that would also be a nice thing to implement so long as it does not make things too unreadable.
In short building scc was a nice diversion from working on https://searchcode.com/ and https://searchcodeserver.com/ and I will probably fold back into that things that I discovered while working on scc.
Enjoy? Hate? Let me know via twitter or email directly.
For my future reference here is a list of tools used to create graphics in the above.
- Charts JSFiddle and Google Charts https://developers.google.com/chart/interactive/docs/gallery/barchart https://jsfiddle.net/23c5cyar/30/
- WebGraphViz for state machine graphic http://webgraphviz.com/